Verified Solution • 2025–26 Session
moderate
QJEEM25Ph5412: JEE Main 2025 Physics - Class 11 JEEM25Ph5412 Solution: For a particular ideal gas which of the following graphs…
For a particular ideal gas which of the following graphs represents the variation of mean squared velocity of the gas molecules with temperature?
Multiple Choice Options
- A https://ik.imagekit.io/novatra/photos/e234e36dbd12117f3e7fb81e311e1ca16d7943465cb21640a88c7fc43caced1a.webp
- B https://ik.imagekit.io/novatra/photos/b2e9601f04efe1adb822f22884513090af44acbfe4d86c72c0bc8cc6dfde62cf.webp
- C https://ik.imagekit.io/novatra/photos/0d07e9444d2dfc63a90fcb4d44f538ae6e89ee412ef2c1b6c89ace94b8789f40.webp
- D https://ik.imagekit.io/novatra/photos/6e243bf591db5880367e01c9cab2268aebd845a90c66f6c981e31e3c6c6e4324.webp
Step-by-Step Verified Solution
We know, for an ideal gas,
i.e. mean squared velocity is directly proportional to temperature.
by comparing it with (straight line)
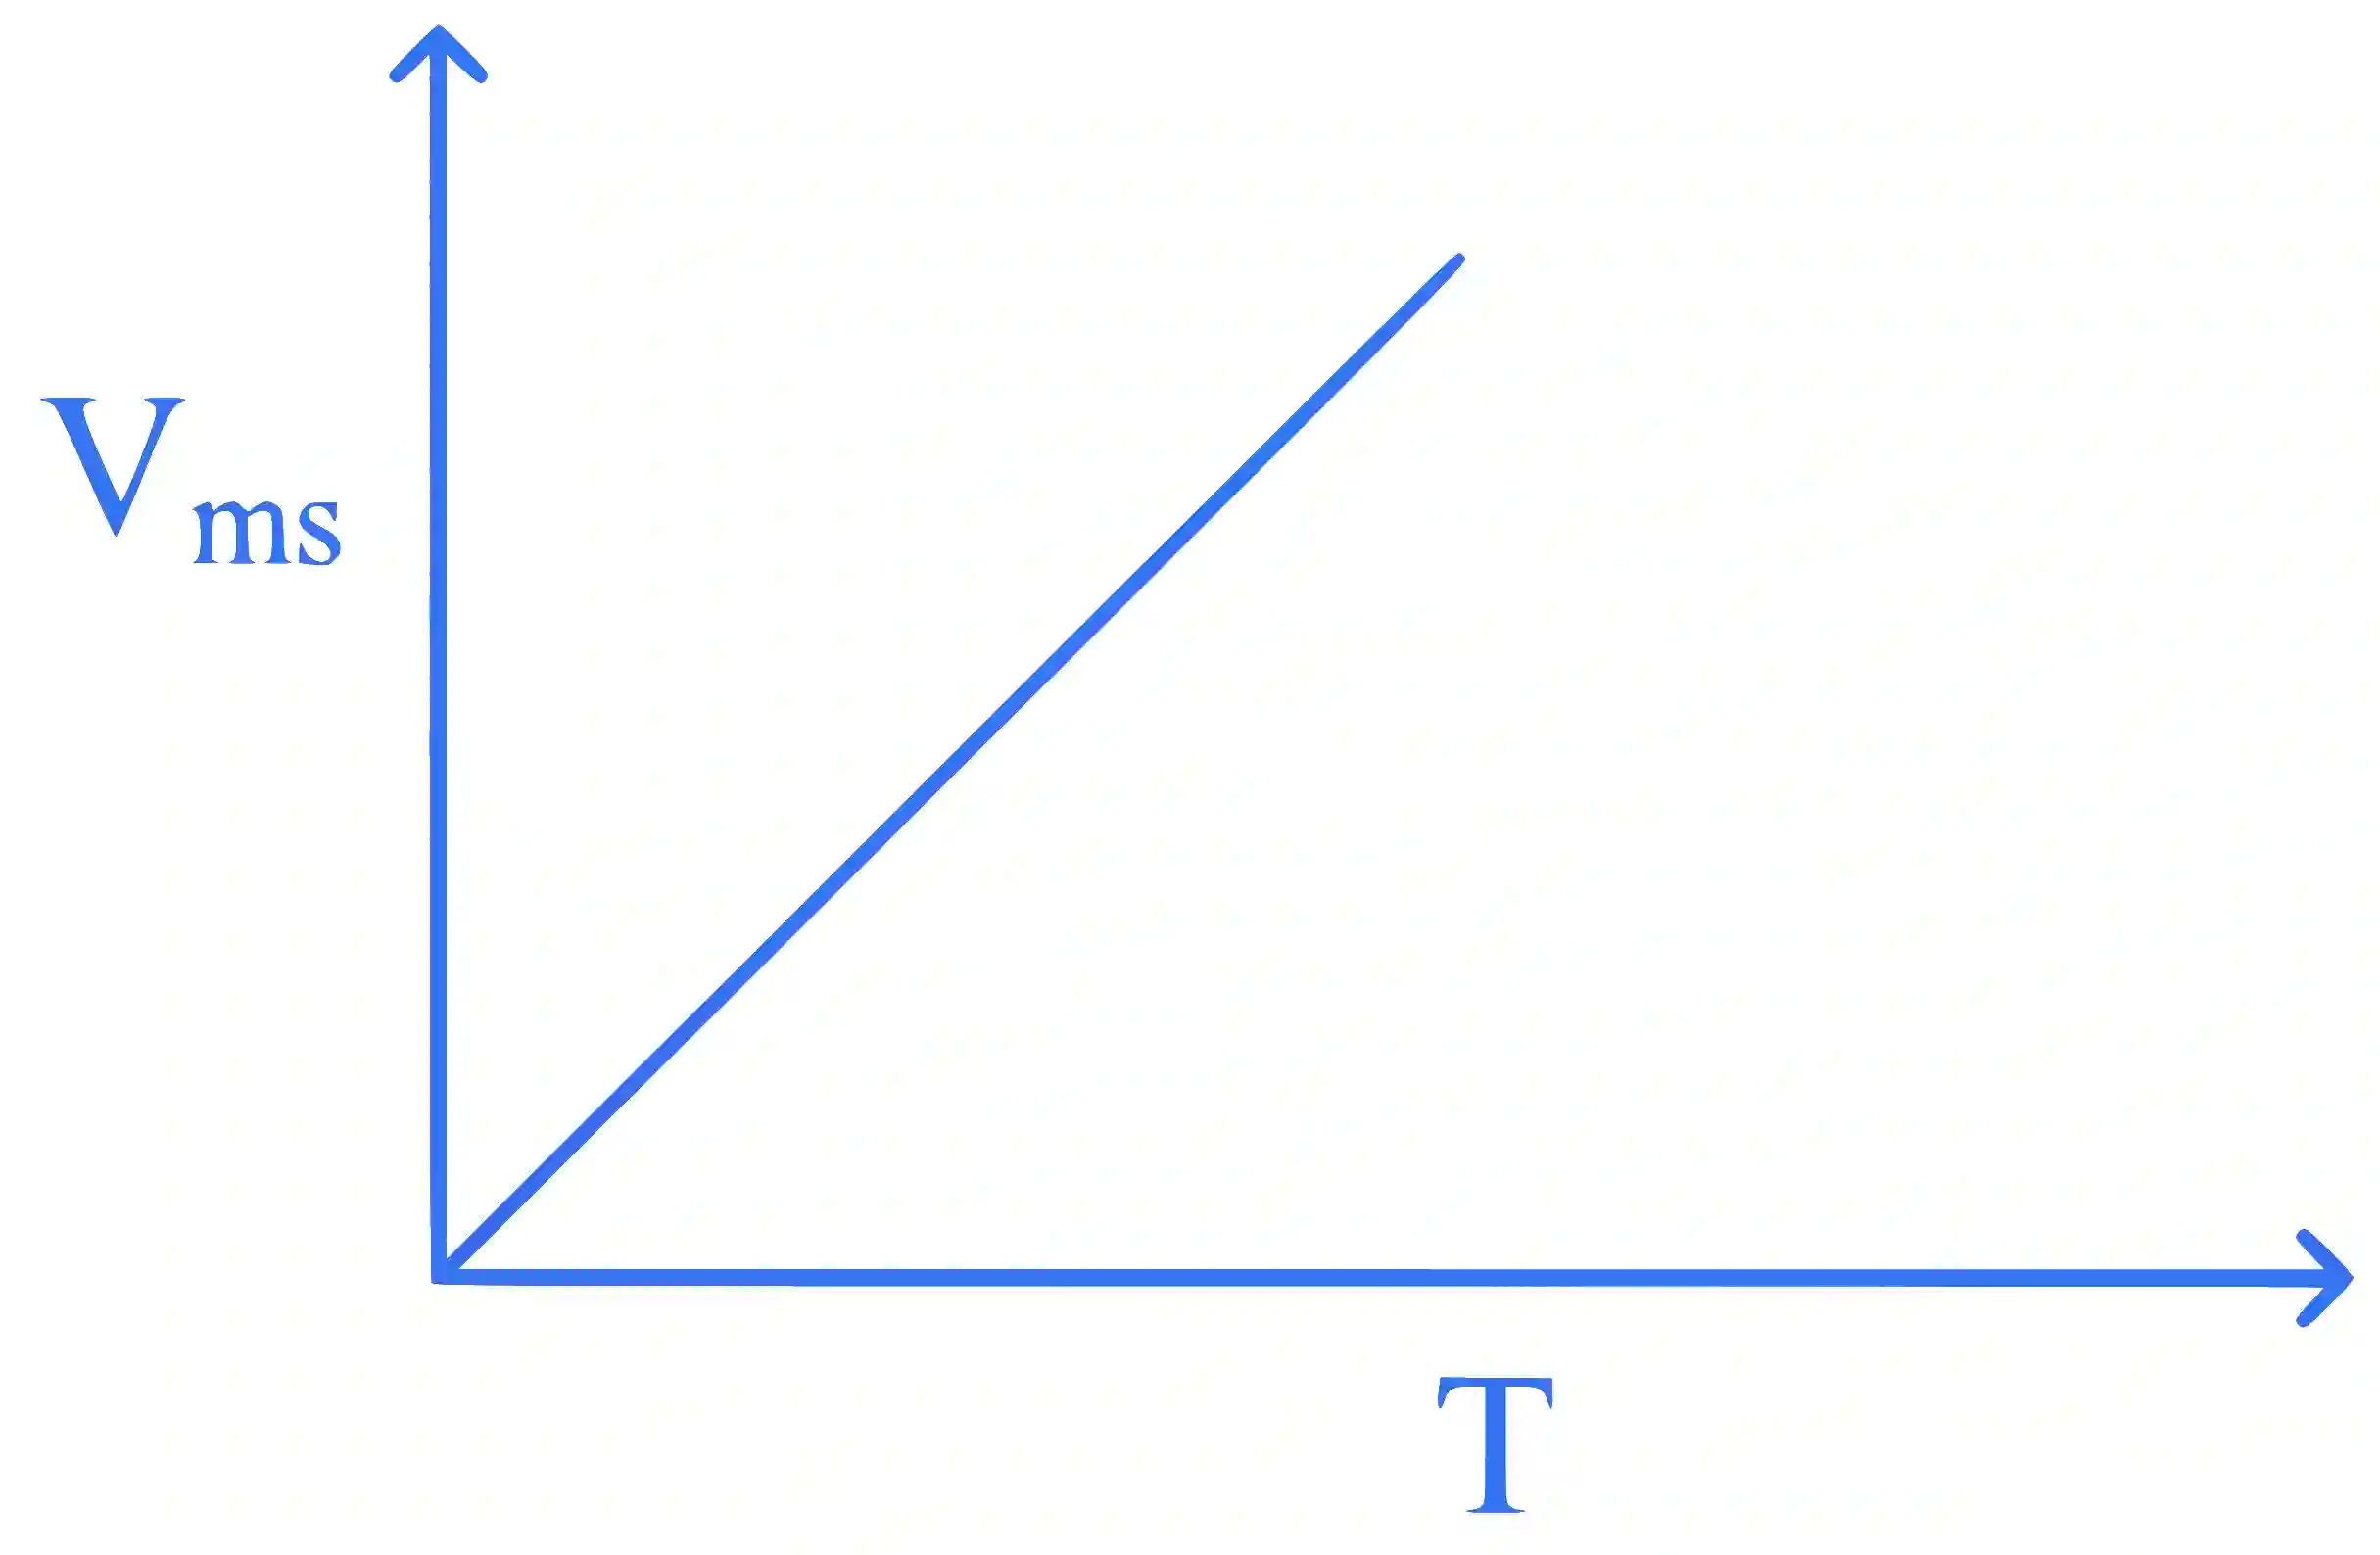
Hence, option 3 is correct.