Verified Solution • 2025–26 Session
moderate
QJEEM25Ch24f0: JEE Main 2025 Chemistry - Class 12 JEEM25Ch24f0 Solution: Consider the given plots of vapour pressure (VP) vs…
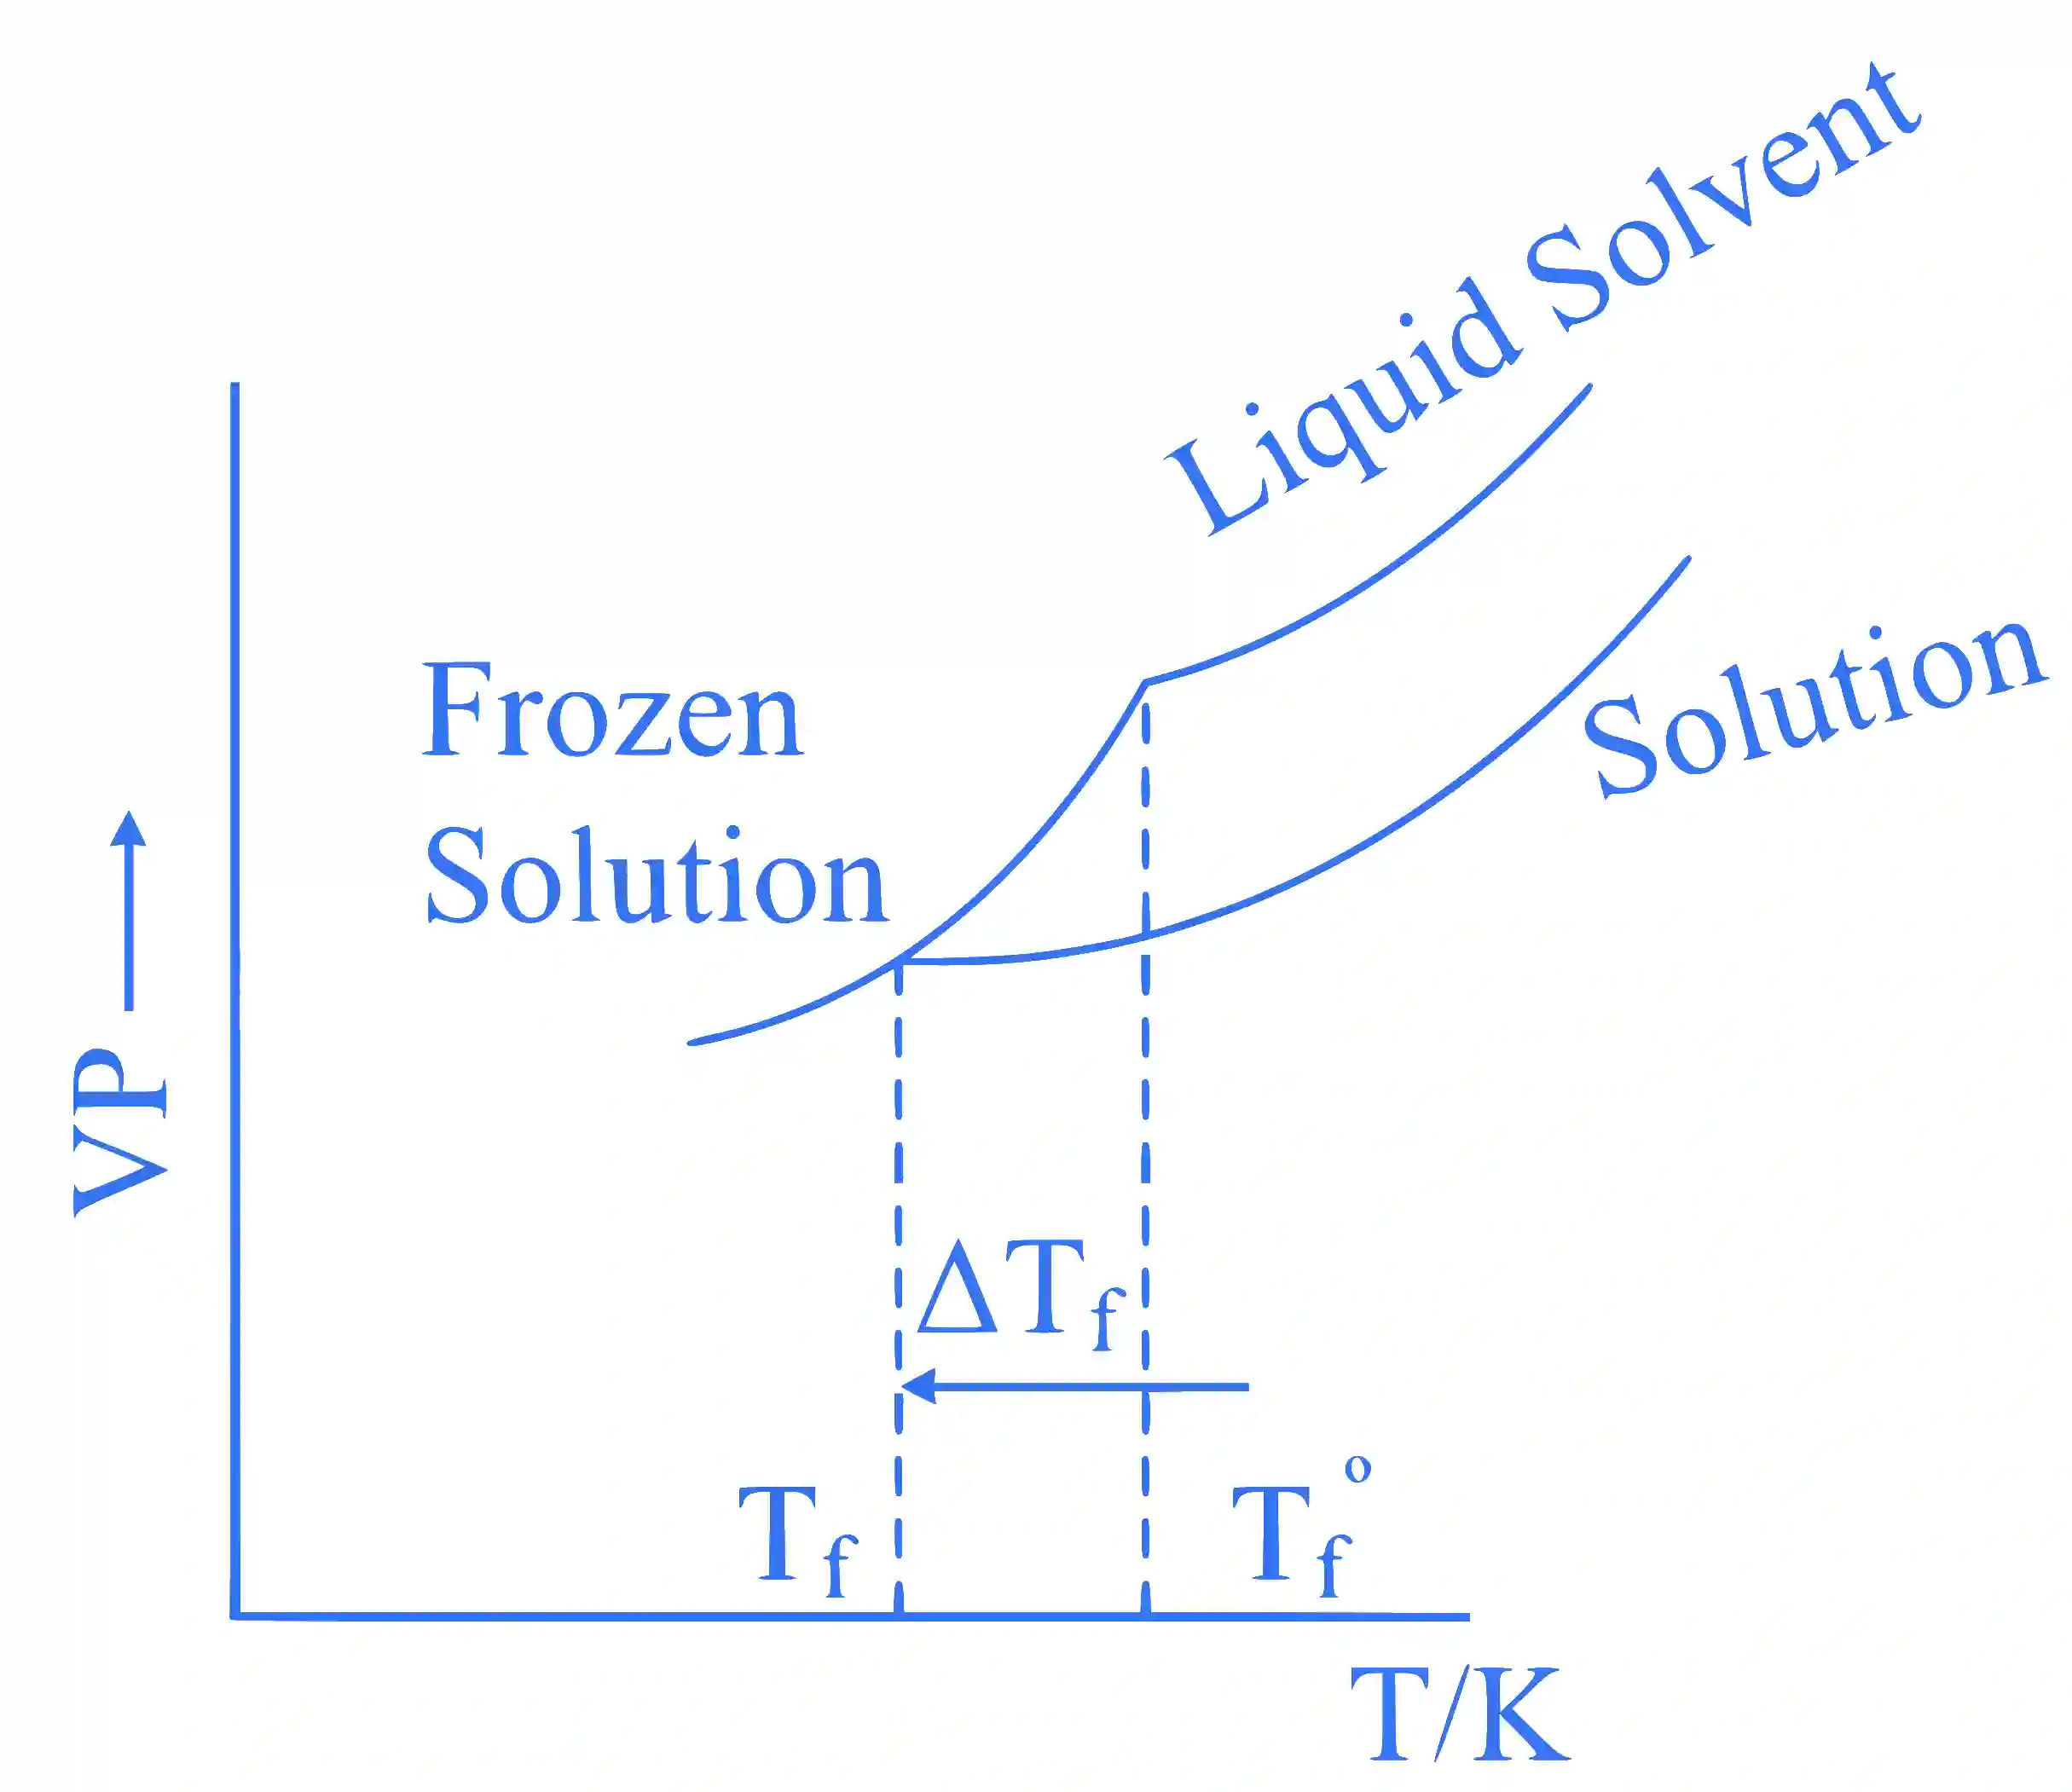
Consider the given plots of vapour pressure (VP) vs temperature(T/K). Which amongst the following options is correct graphical representation showing , depression in the freezing point of a solvent in a solution?
Multiple Choice Options
- A https://ik.imagekit.io/novatra/photos/fd4211532cb8d207c447055da298d3425e7d250128ca2f54f59ffc6e8555f01f.webp
- B https://ik.imagekit.io/novatra/photos/60c783b308feaf7c68a087c5995456110feda16031f66af9532bd922375375da.webp
- C https://ik.imagekit.io/novatra/photos/3073cef46264930aa1919b510be73b79d6252cc5b6638cc6bca14d3f16eec836.webp
- D https://ik.imagekit.io/novatra/photos/de94eebb96c317903584d4dde1de08713bd9316c681ddee41a972d52a746d20a.webp
Step-by-Step Verified Solution
On adding non-volatile solute in a solvent, the freezing point of solution decreases.
\mathrm{T}_{\mathrm{f}}<\mathrm{T}_{\mathrm{f}}^0
F.P. of solution < F.P. of pure solvent
Also V.P. of solution decreases on adding nonvolatile solute in a solvent.