QJEEM24Ph0607: JEE Main 2024 Physics - Class 11 JEEM24Ph0607 Solution: The given figure represents two isobaric processes for the same …
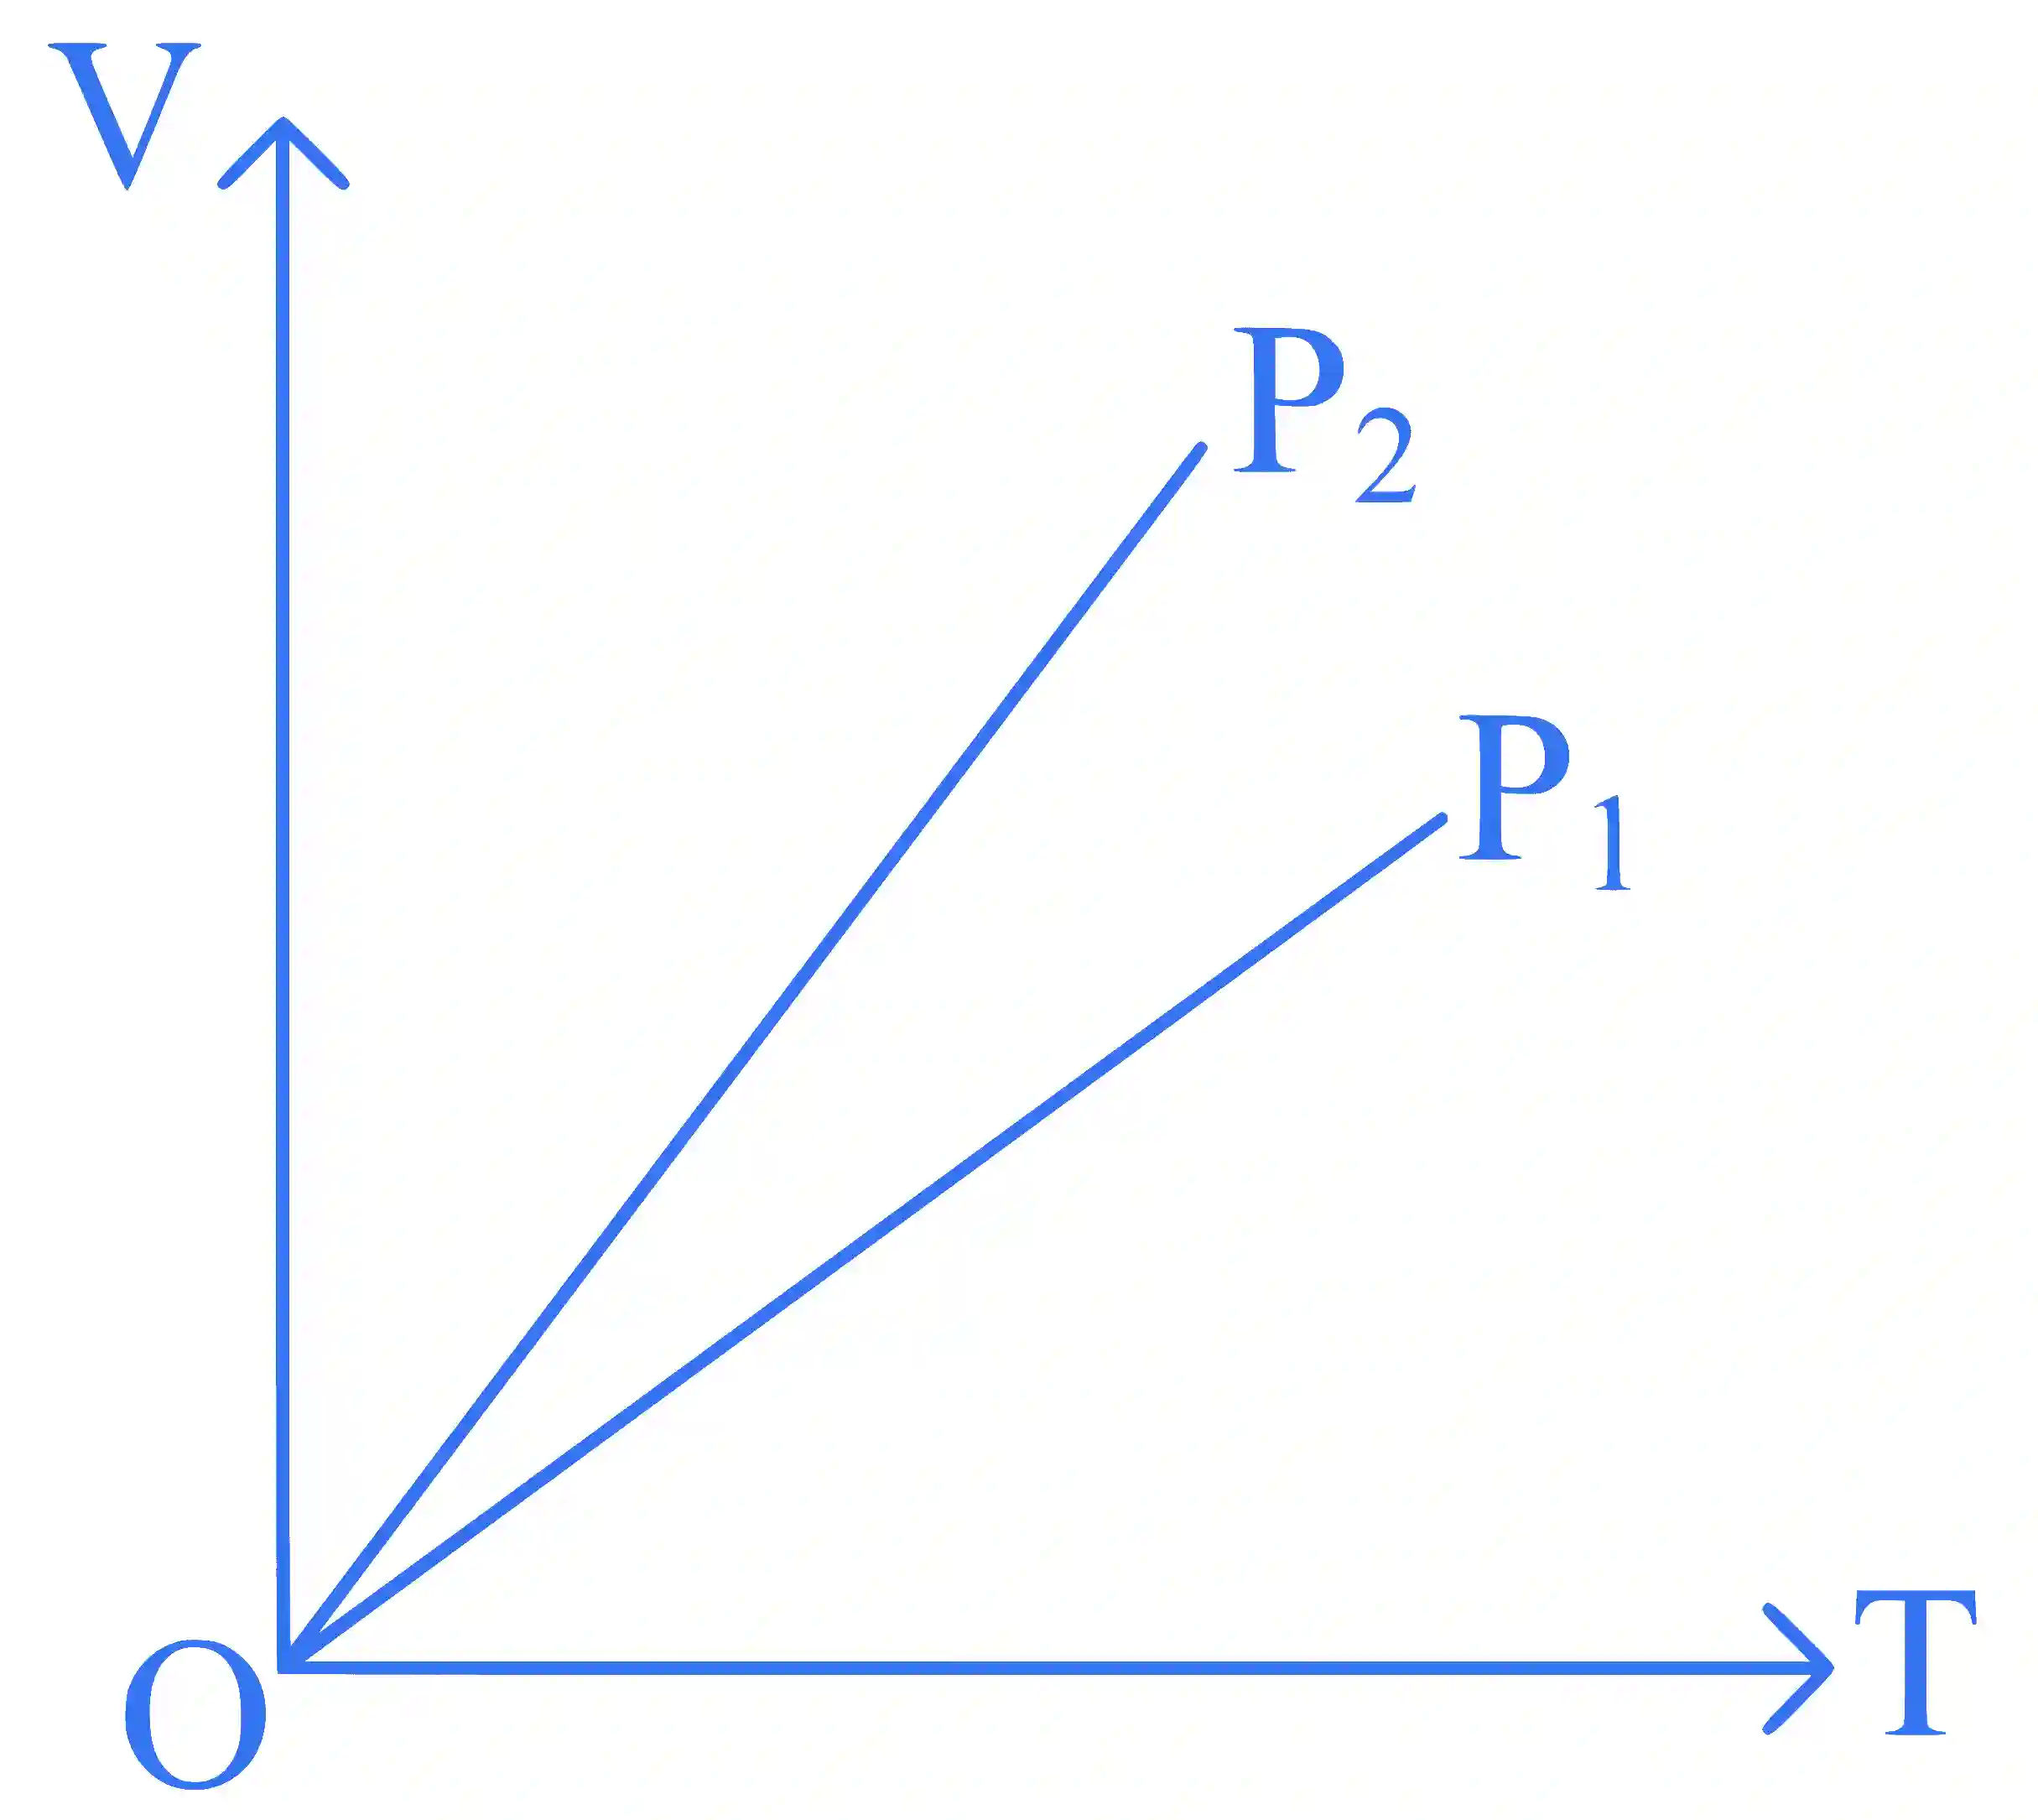
The given figure represents two isobaric processes for the same mass of an ideal gas, then
Multiple Choice Options
- A
- B
- C
- D
Step-by-Step Verified Solution
The two isobaric processes depicted in the figure show changes in the volume of an ideal gas with temperature under constant pressure conditions.
Isobaric processes follow the equation , where P is pressure, V is volume, n is the number of moles of the gas, R is the ideal gas constant, and T is temperature.
When we rearrange the equation in terms of V (Volume), we get . The slope of the volume-temperature graph in such a scenario is given by . This implies that the slope is inversely proportional to the pressure (i.e., slope ).
From this relationship, if one process has a higher slope compared to another, its corresponding pressure must be lower. Observing the given figure and applying this understanding, if Process 2 has a greater slope than Process 1, it indicates that P_2 < P_1 .