Verified Solution • 2025–26 Session moderate

QJEEM23Phac42: JEE Main 2023 Physics - Class 11 JEEM23Phac42 Solution: The figure represents the momentum time ( p − t ) curve for a…

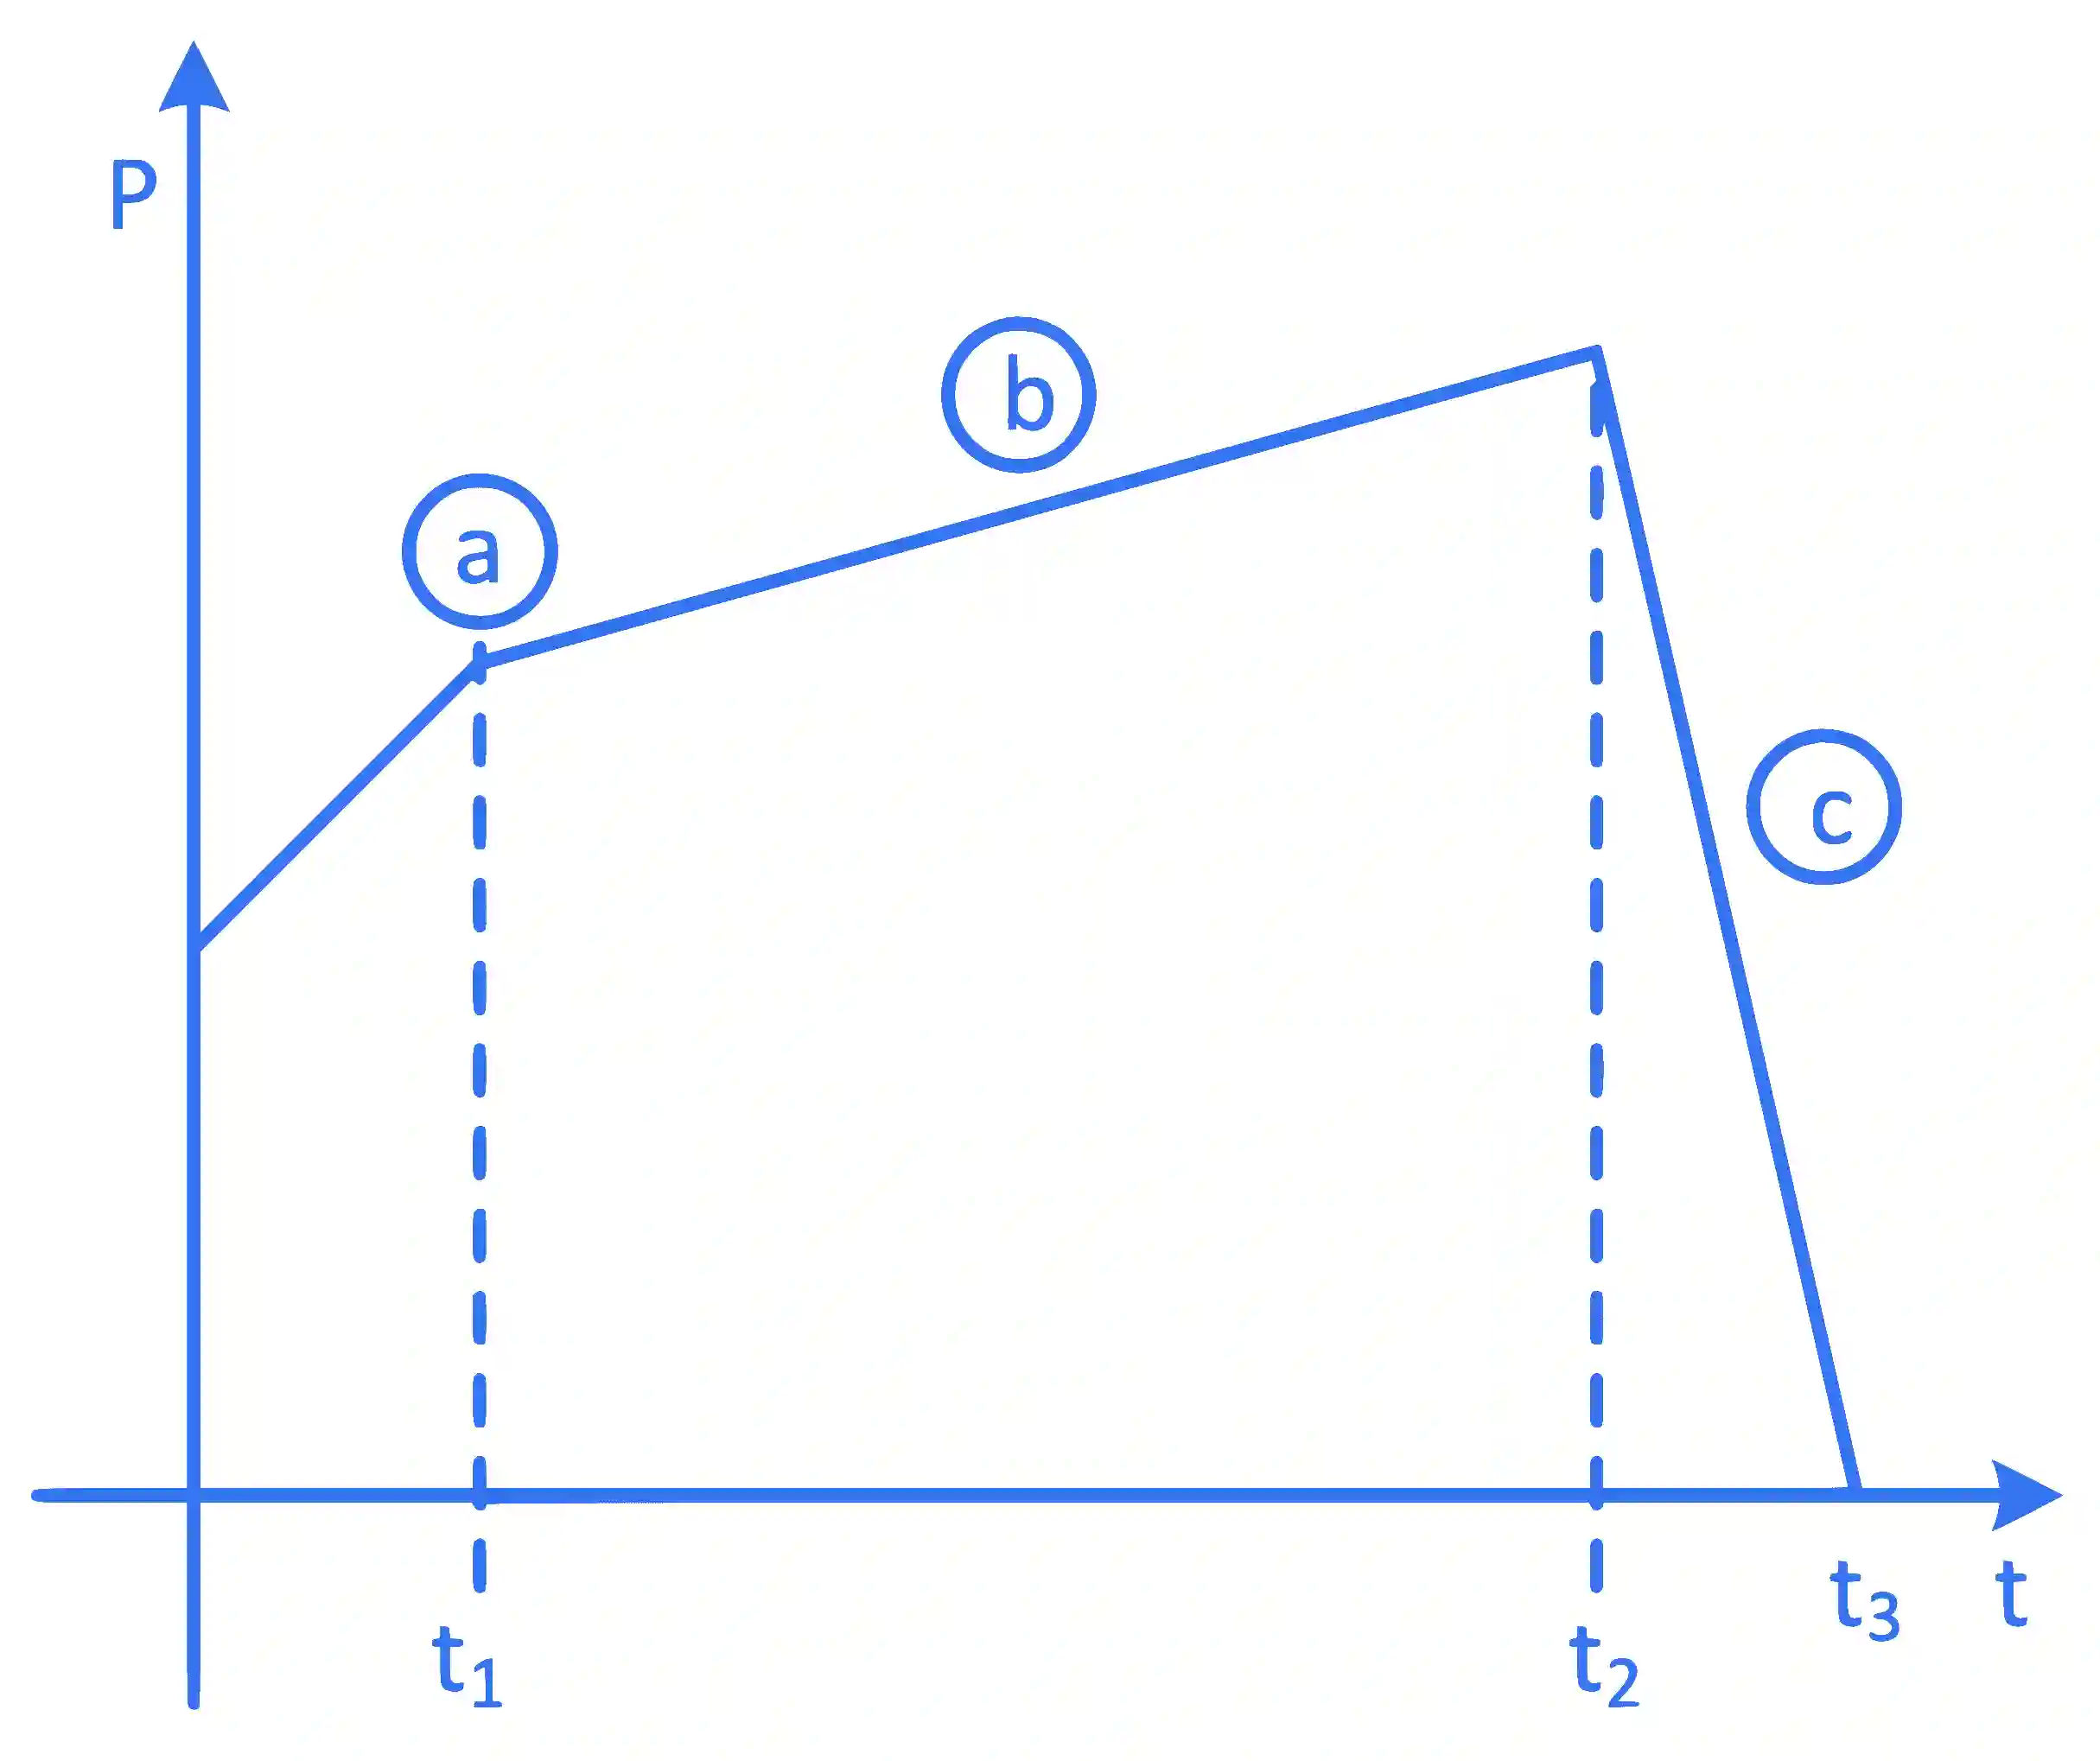
The figure represents the momentum time (p−t) curve for a particle moving along an axis under the influence of the force. Identify the regions on the graph where the magnitude of the force is maximum and minimum respectively?

If (t3−t2)<t1

JEE Main 2023 (Online) 30th January Morning Shift Physics - Center of Mass and Collision Question 22 English

Multiple Choice Options

  • A b and c
  • B c and a
  • C a and b
  • D c and b

Step-by-Step Verified Solution

F=dpdt

⇒|F|=|dpdt|=|slopeofp−tcurve|

As we can see from graph,

|Fc| is maximum and |Fb| is minimum.

Related Learning Resources & Exam Preparation