Verified Solution • 2025–26 Session
moderate
QJEEM23Chcad7: JEE Main 2023 Chemistry - Class 11 JEEM23Chcad7 Solution: Henry Moseley studied characteristic X-ray spectra of elements. …
Henry Moseley studied characteristic X-ray spectra of elements. The graph which represents his observation correctly is
Given frequency of -ray emitted
Z = atomic number
Multiple Choice Options
- A https://ik.imagekit.io/novatra/photos/ea88184ffaac959f57f2d423d4d96496916516a975f928f3d75608dd7e0c7d46.webp
- B https://ik.imagekit.io/novatra/photos/2ef2c5902fac52fa5152166a9020c3385054e55deeb6ebf86174abf56695d7ff.webp
- C https://ik.imagekit.io/novatra/photos/0baf760663a3fc21b71e28f578f10275f05ec3c83d1d9e821c326a35b19fe023.webp
- D https://ik.imagekit.io/novatra/photos/d90138ebde242f4f87c6457f511a7b3ff36fdac550d1749c794a4fb9420e26d7.webp
Step-by-Step Verified Solution
Moseley's observation on characteristic X-ray spectra of elements relates frequency of X-rays emitted to the atomic number by the following relation:
The plot of vs is linear with -ve intercept on Y-axis.
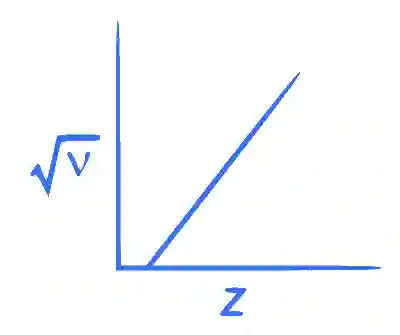
Out of the four graphs given, graph (B) can be considered correct but it needs to be modified with respect to intercept on Y-axis.
The plot of vs is linear with -ve intercept on Y-axis.
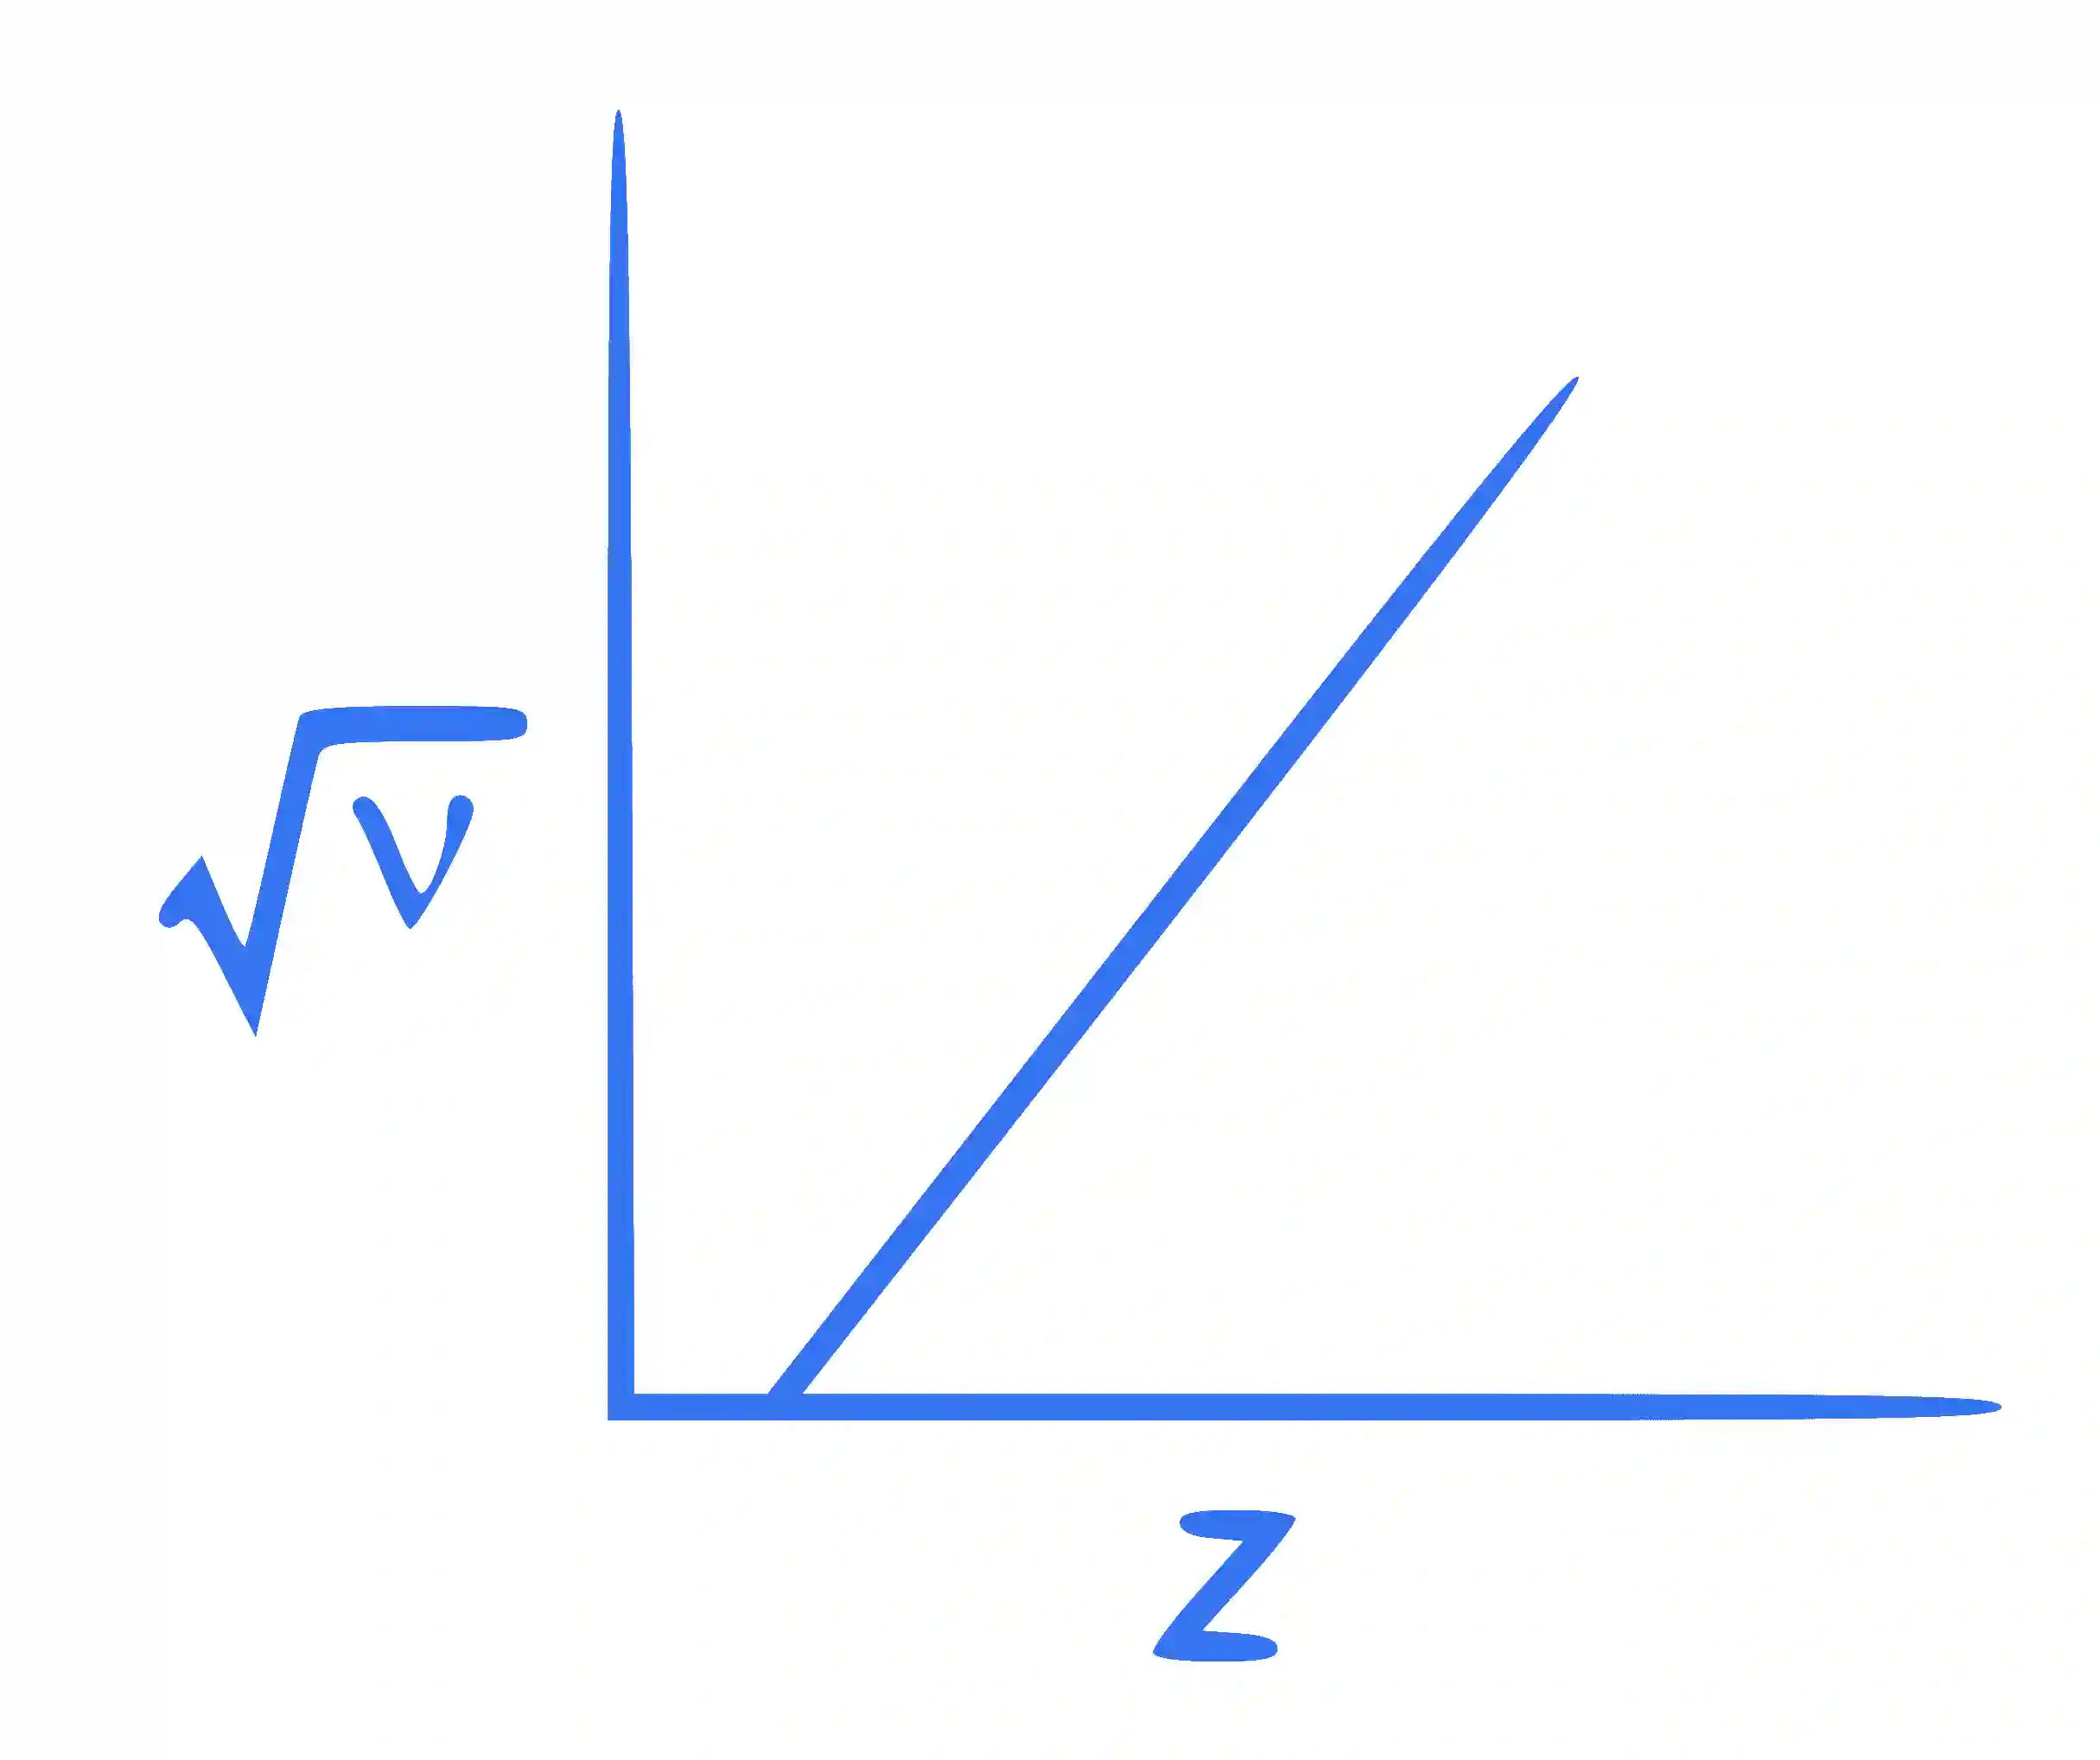
Out of the four graphs given, graph (B) can be considered correct but it needs to be modified with respect to intercept on Y-axis.