QJEEM23Chc63e: JEE Main 2023 Chemistry - Class 12 JEEM23Chc63e Solution: Gibbs energy vs T plot for the formation of oxides is given…
Gibbs energy vs T plot for the formation of oxides is given below.
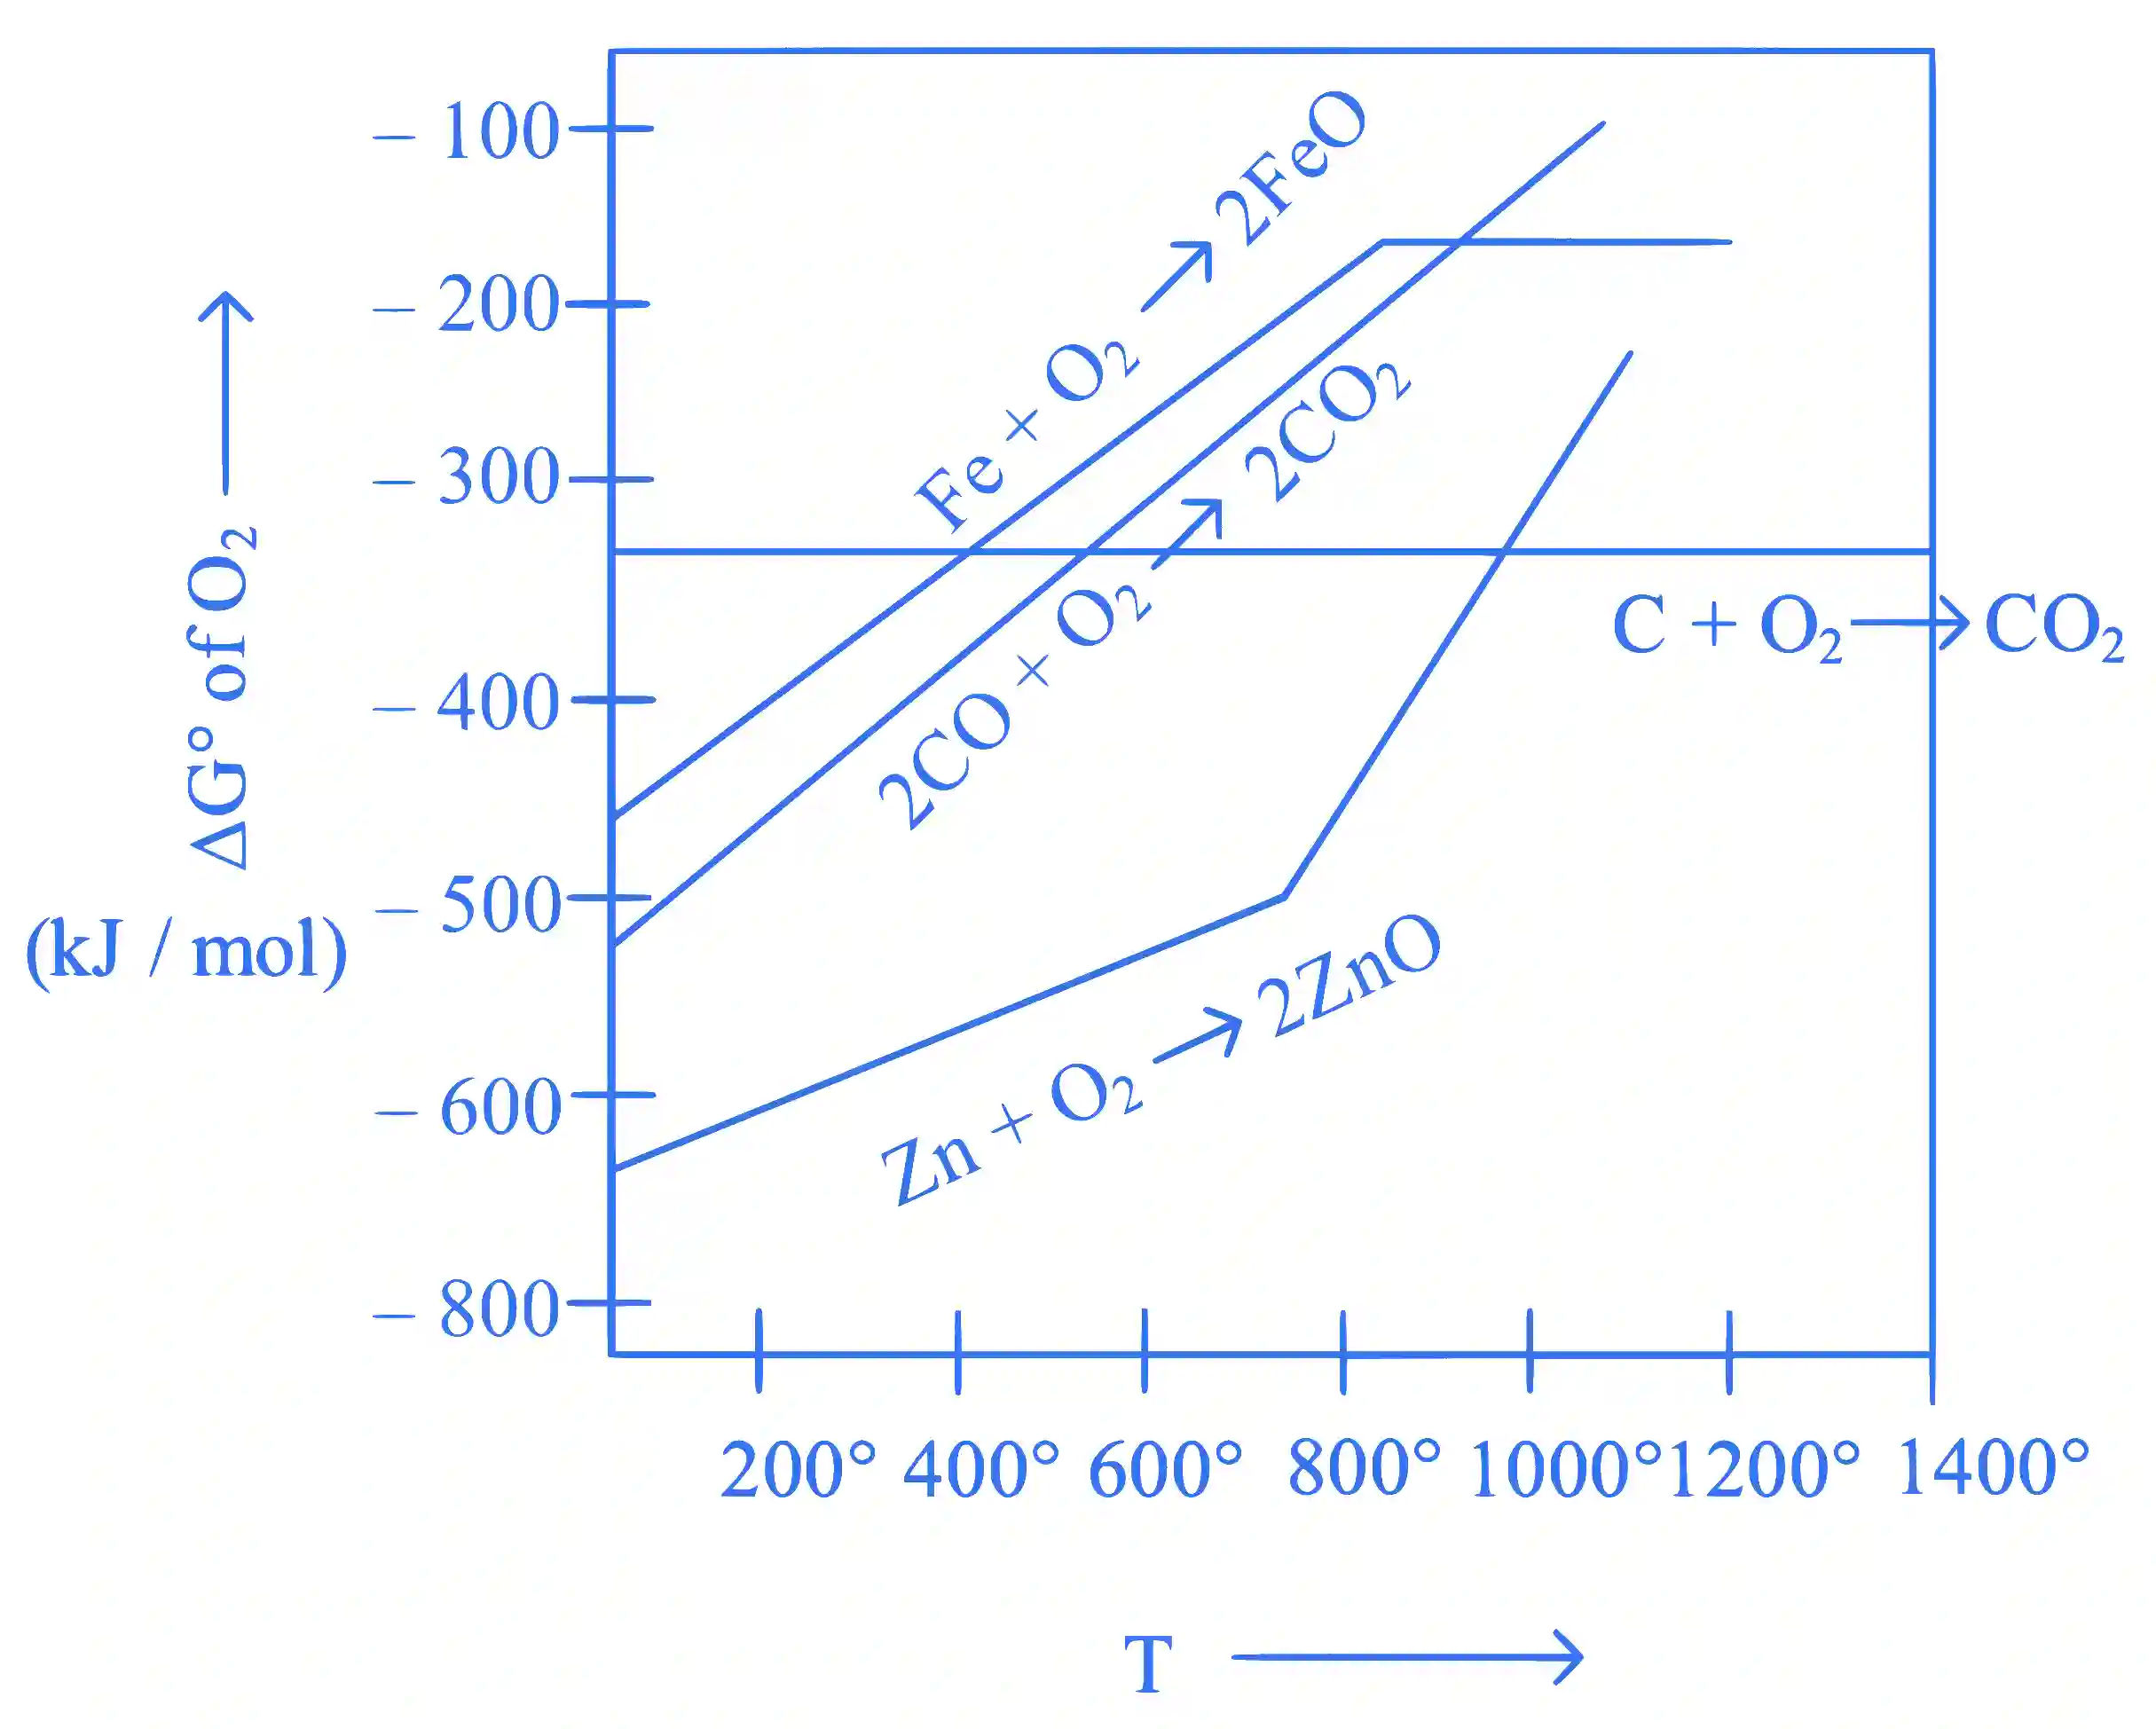
For the given diagram, the correct statement is -
Multiple Choice Options
- A At 600∘C,C can reduce FeO
- B At 600∘C,C can reduce ZnO
- C At 600∘C,CO can reduce ZnO
- D At 600∘C,CO cannot reduce FeO
Step-by-Step Verified Solution
The Ellingham diagram is a graphical representation of the Gibbs Free Energy change of various reactions, mainly reduction reactions of metal oxides to the metal. The temperature is plotted on the x-axis, and the Gibbs Free Energy per mole of O2 is plotted on the y-axis.
In the Ellingham diagram, each reaction's line has a positive slope because the entropy change for the reactions is positive (we're converting a solid and a gas into more moles of gas), and the Gibbs free energy change, ΔG, is given by ΔG = ΔH - TΔS. Therefore, the ΔG becomes more negative as T increases.
It's important to note that a more negative ΔG indicates a more spontaneous reaction, i.e., the reaction is more likely to occur. Thus, substances lower on the Ellingham diagram are more likely to reduce the substances above them.
In the diagram provided, the line for C is below the line for FeO at 600°C. This implies that Carbon can reduce Iron(II) oxide to Iron at this temperature.
Therefore, the statement "At