Verified Solution • 2025–26 Session
moderate
QJEEM21Ch3d8b: JEE Main 2021 Chemistry - Class 12 JEEM21Ch3d8b Solution: Which one of the following given graphs represents the…
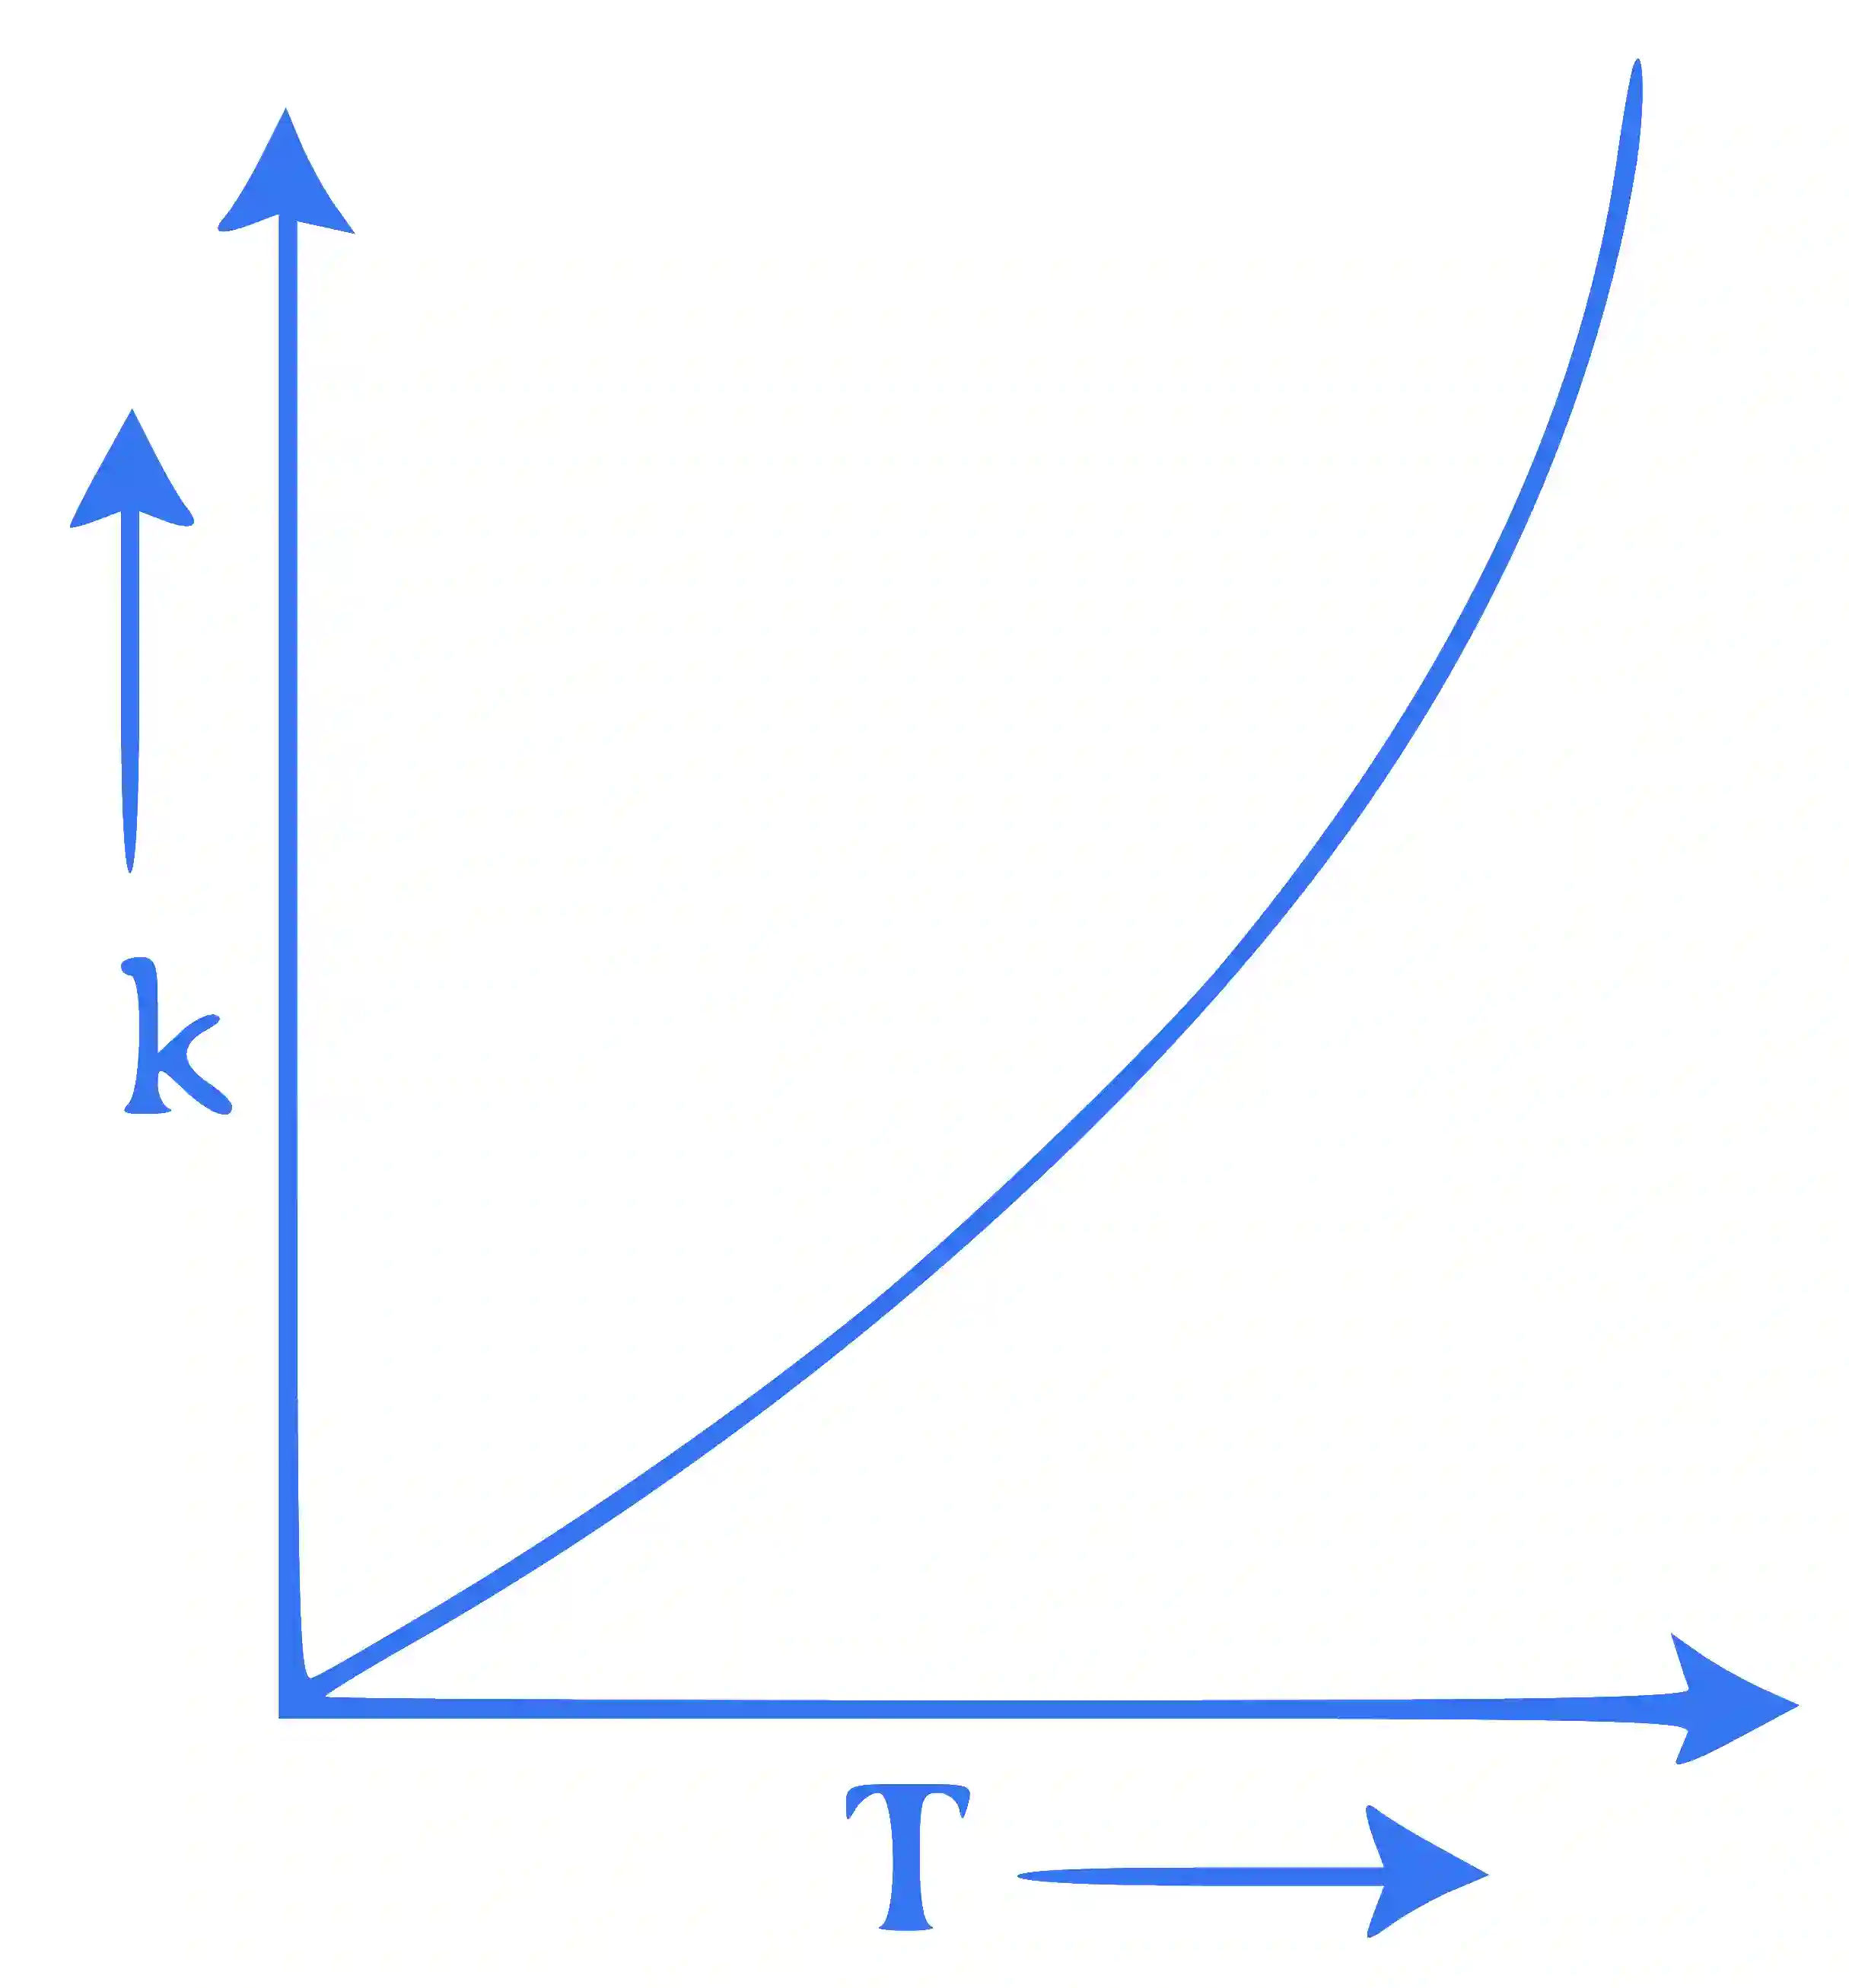
Which one of the following given graphs represents the variation of rate constant (k) with temperature (T) for an endothermic reaction?
Multiple Choice Options
- A https://ik.imagekit.io/novatra/photos/4e1b256f76fdce719045a10afc17010a764115a7a3d7cd5cc6f969c0925c32a1.webp
- B https://ik.imagekit.io/novatra/photos/fe74bbd9d672fc0bbff5be4a4c00ac7e96ce3e9347882df296c2156bd385ee2b.webp
- C https://ik.imagekit.io/novatra/photos/84505cdcaccc75333ba65e422de06797bf7df0b6a566d9bb0f0ff4c0f6732f38.webp
- D https://ik.imagekit.io/novatra/photos/3aefe58adfd1fa94610154981cd93369f286183806df0e73d3b79f3aa0a81a7f.webp
Step-by-Step Verified Solution
According to Arrhenius equation
The graph will varies as

The graph will varies as