Verified Solution • 2025–26 Session
moderate
QJEEM20Ph18e8: JEE Main 2020 Physics - Class 11 JEEM20Ph18e8 Solution: A thermodynamic cycle xyzx is shown on a V-T diagram. The P-V…
A thermodynamic cycle xyzx is shown on a V-T diagram. 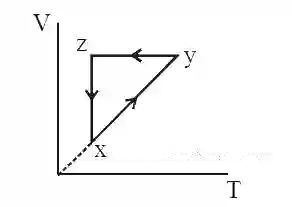 The P-V diagram that best describes this cycle is :
(Diagrams are schematic and not to scale)
The P-V diagram that best describes this cycle is :(Diagrams are schematic and not to scale)
Multiple Choice Options
- A https://ik.imagekit.io/novatra/photos/8df89bb4f6a145f593fda1dfea9af65cb6c36eadeeea99cd9615366fbb109e6a.webp
- B https://ik.imagekit.io/novatra/photos/41f0b1f473976984c5c509d8923c96774ef621a8afd2a84c4dffec2f52d781c6.webp
- C https://ik.imagekit.io/novatra/photos/d2323c7bb4d8d9c97087484b50cddbd95b673ae949a3ea903ffdf9a9c348d2da.webp
- D https://ik.imagekit.io/novatra/photos/e3ff0a4a6953d29a1ef86b241441699dc518cf69a1cfa9903df5f533ac549ed5.webp
Step-by-Step Verified Solution
From the corresponding V-T graph
Process x y is Isobaric expansion (pressure = constant )
Process y z is Isochoric (volume = constant)
Process z x is Isothermal compression (temperature = constant)
Therefore, (A) is correct P-V graph.
Process x y is Isobaric expansion (pressure = constant )
Process y z is Isochoric (volume = constant)
Process z x is Isothermal compression (temperature = constant)
Therefore, (A) is correct P-V graph.