Verified Solution • 2025–26 Session
moderate
QJEEM19Phf71e: JEE Main 2019 Physics - Class 12 JEEM19Phf71e Solution: The graph shows how the magnification m produced by a thin lens …
The graph shows how the magnification m produced by a thin lens varies with image distance v. What is the focal length of the lens used? 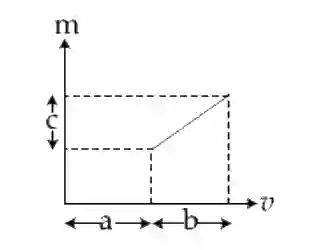
Multiple Choice Options
- A
- B
- C
- D
Step-by-Step Verified Solution
As the graph between magnification (m) and image distance (v) varies linearly, then
m = k1v + k2
Clearly, and k2 = 1 here
m = k1v + k2
Clearly, and k2 = 1 here