B https://ik.imagekit.io/novatra/photos/3165207ca9be617cf52cea35fb770fbdf1a5585d3a6f28d769da7ccbd33a8a26.webp
C https://ik.imagekit.io/novatra/photos/44f5bd9c65c306751dd63c063dd82dc0e972b53895f9cf74d8caedb062d6ba18.webp
D https://ik.imagekit.io/novatra/photos/ca67e1764677c566733b3250170c41d04cd2a0ca5703e22aa4adbdd58b4f3489.webp
Step-by-Step Verified Solution
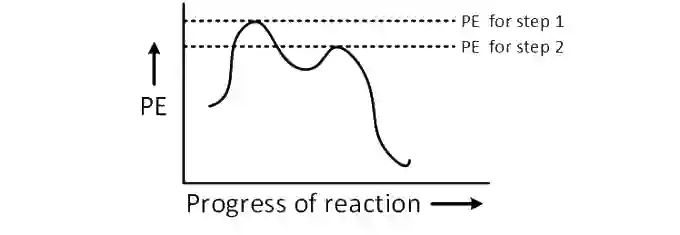
SN1 reaction happens in two steps :
1st step : Formation of carbocation intermediate when leaving group leaves.
2nd step : The nucleophile attacks the carbocation, forming the product.
In SN1 reaction, formation of carbocation (1st step) is called rate determining step (RDS). RDS is the most difficult and slowest step. That is why potential energy required to complete first step is more compare to the second step.