Verified Solution • 2025–26 Session
moderate
QJEEM19Ch9c22: JEE Main 2019 Chemistry - Class 11 JEEM19Ch9c22 Solution: Points I, II and III in the following plot respectively…
Points I, II and III in the following plot respectively correspond to
(Vmp : most probable velocity)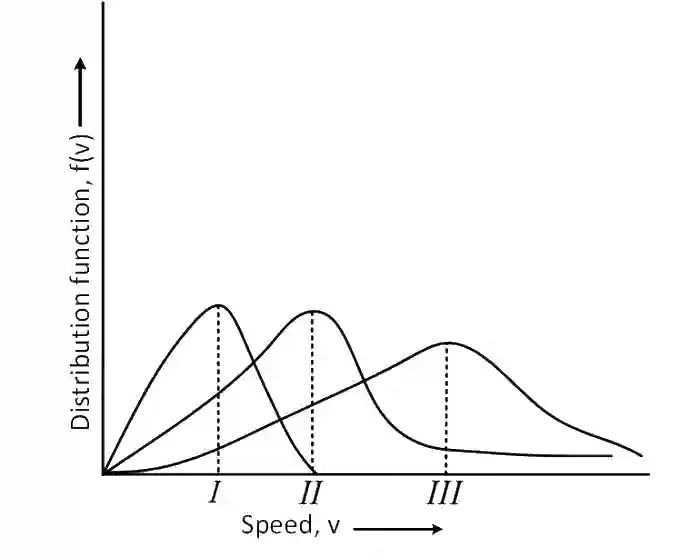
(Vmp : most probable velocity)

Multiple Choice Options
- A Vmp of O2 (400 K); Vmp of N2 (300 K); Vmp of H2 (300 K)
- B Vmp of N2 (300 K); Vmp of H2 (300 K); Vmp of O2 (400 K)
- C Vmp of H2 (300 K); Vmp of N2 (300 K); Vmp of O2 (400 K)
- D Vmp of N2 (300 K); Vmp of O2 (400 K); Vmp of H2 (300 K)
Step-by-Step Verified Solution
According to the graph,
VI < VII < VIII
We know,
Vmp =
Vmp (H2 at 300 K) =
Vmp (O2 at 400 K) =
Vmp (N2 at 300 K) =
VI < VII < VIII
We know,
Vmp =
Vmp (H2 at 300 K) =
Vmp (O2 at 400 K) =
Vmp (N2 at 300 K) =