Verified Solution • 2025–26 Session
moderate
QJEEM19Ch6cef: JEE Main 2019 Chemistry - Class 12 JEEM19Ch6cef Solution: The given plots represent the variation of the concentration of …
The given plots represent the variation of the concentration of a reactant R with time for two different reactions (i) and (ii). The respective orders of the reactions are : 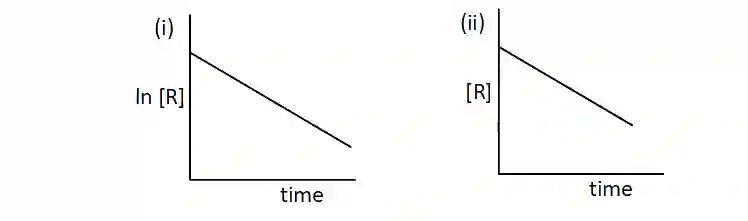
Multiple Choice Options
- A 1,0
- B 0,2
- C 1,1
- D 0,1
Step-by-Step Verified Solution
For 1st order reaction, we know
So,
For Zeroorder reaction, we know
R0 - Rt = kt
So,
So,
For Zeroorder reaction, we know
R0 - Rt = kt
So,