Verified Solution • 2025–26 Session
moderate
QJEEM19Ch04e6: JEE Main 2019 Chemistry - Class 11 JEEM19Ch04e6 Solution: The combination of plots which does not represent isothermal…
The combination of plots which does not represent isothermal expansion of an ideal gas is –
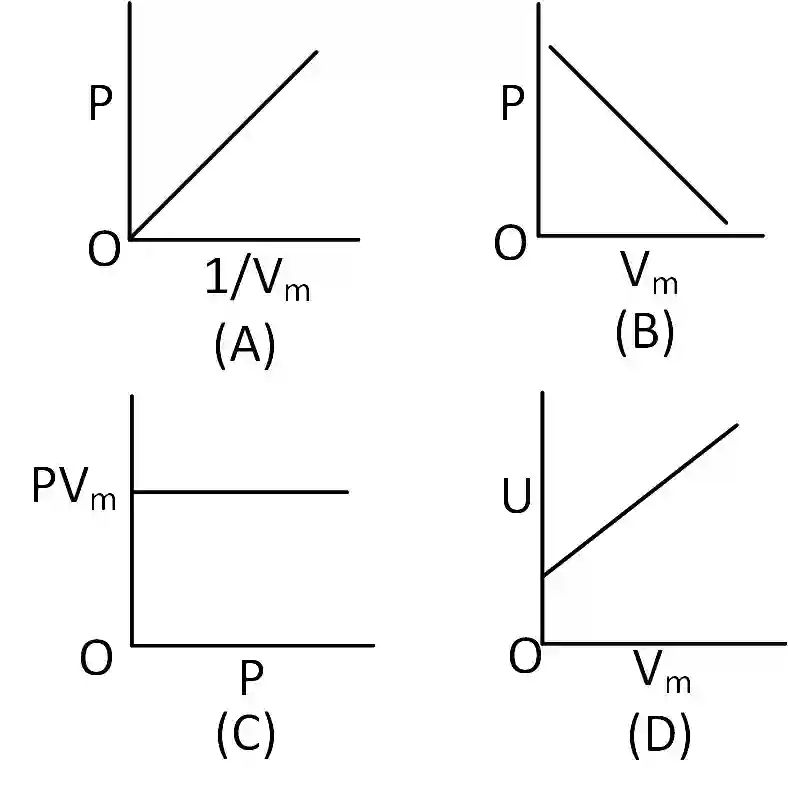
Multiple Choice Options
- A A and D
- B B and D
- C B and C
- D A and C
Step-by-Step Verified Solution
For isothermal process of ideal gas,
PV = constants = K
P =
So, the graph between P and is straight line passing through the origin. So, graph (A) is correct.
As PV = K so the P and V curve is hyperbola. So, graph (B) is wrong.
In isothermal PV = constant.
So, graph (C) is right.
We know internal energy (u) = nRT. Internal energy is function of temperature (T) only. So, U does not change when volume(V) changes. So, graph (D) is wrong.