Verified Solution • 2025–26 Session
moderate
QJEEM18Phf337: JEE Main 2018 Physics - Class 11 JEEM18Phf337 Solution: The velocity-time graphs of a car and a scooter are shown in…
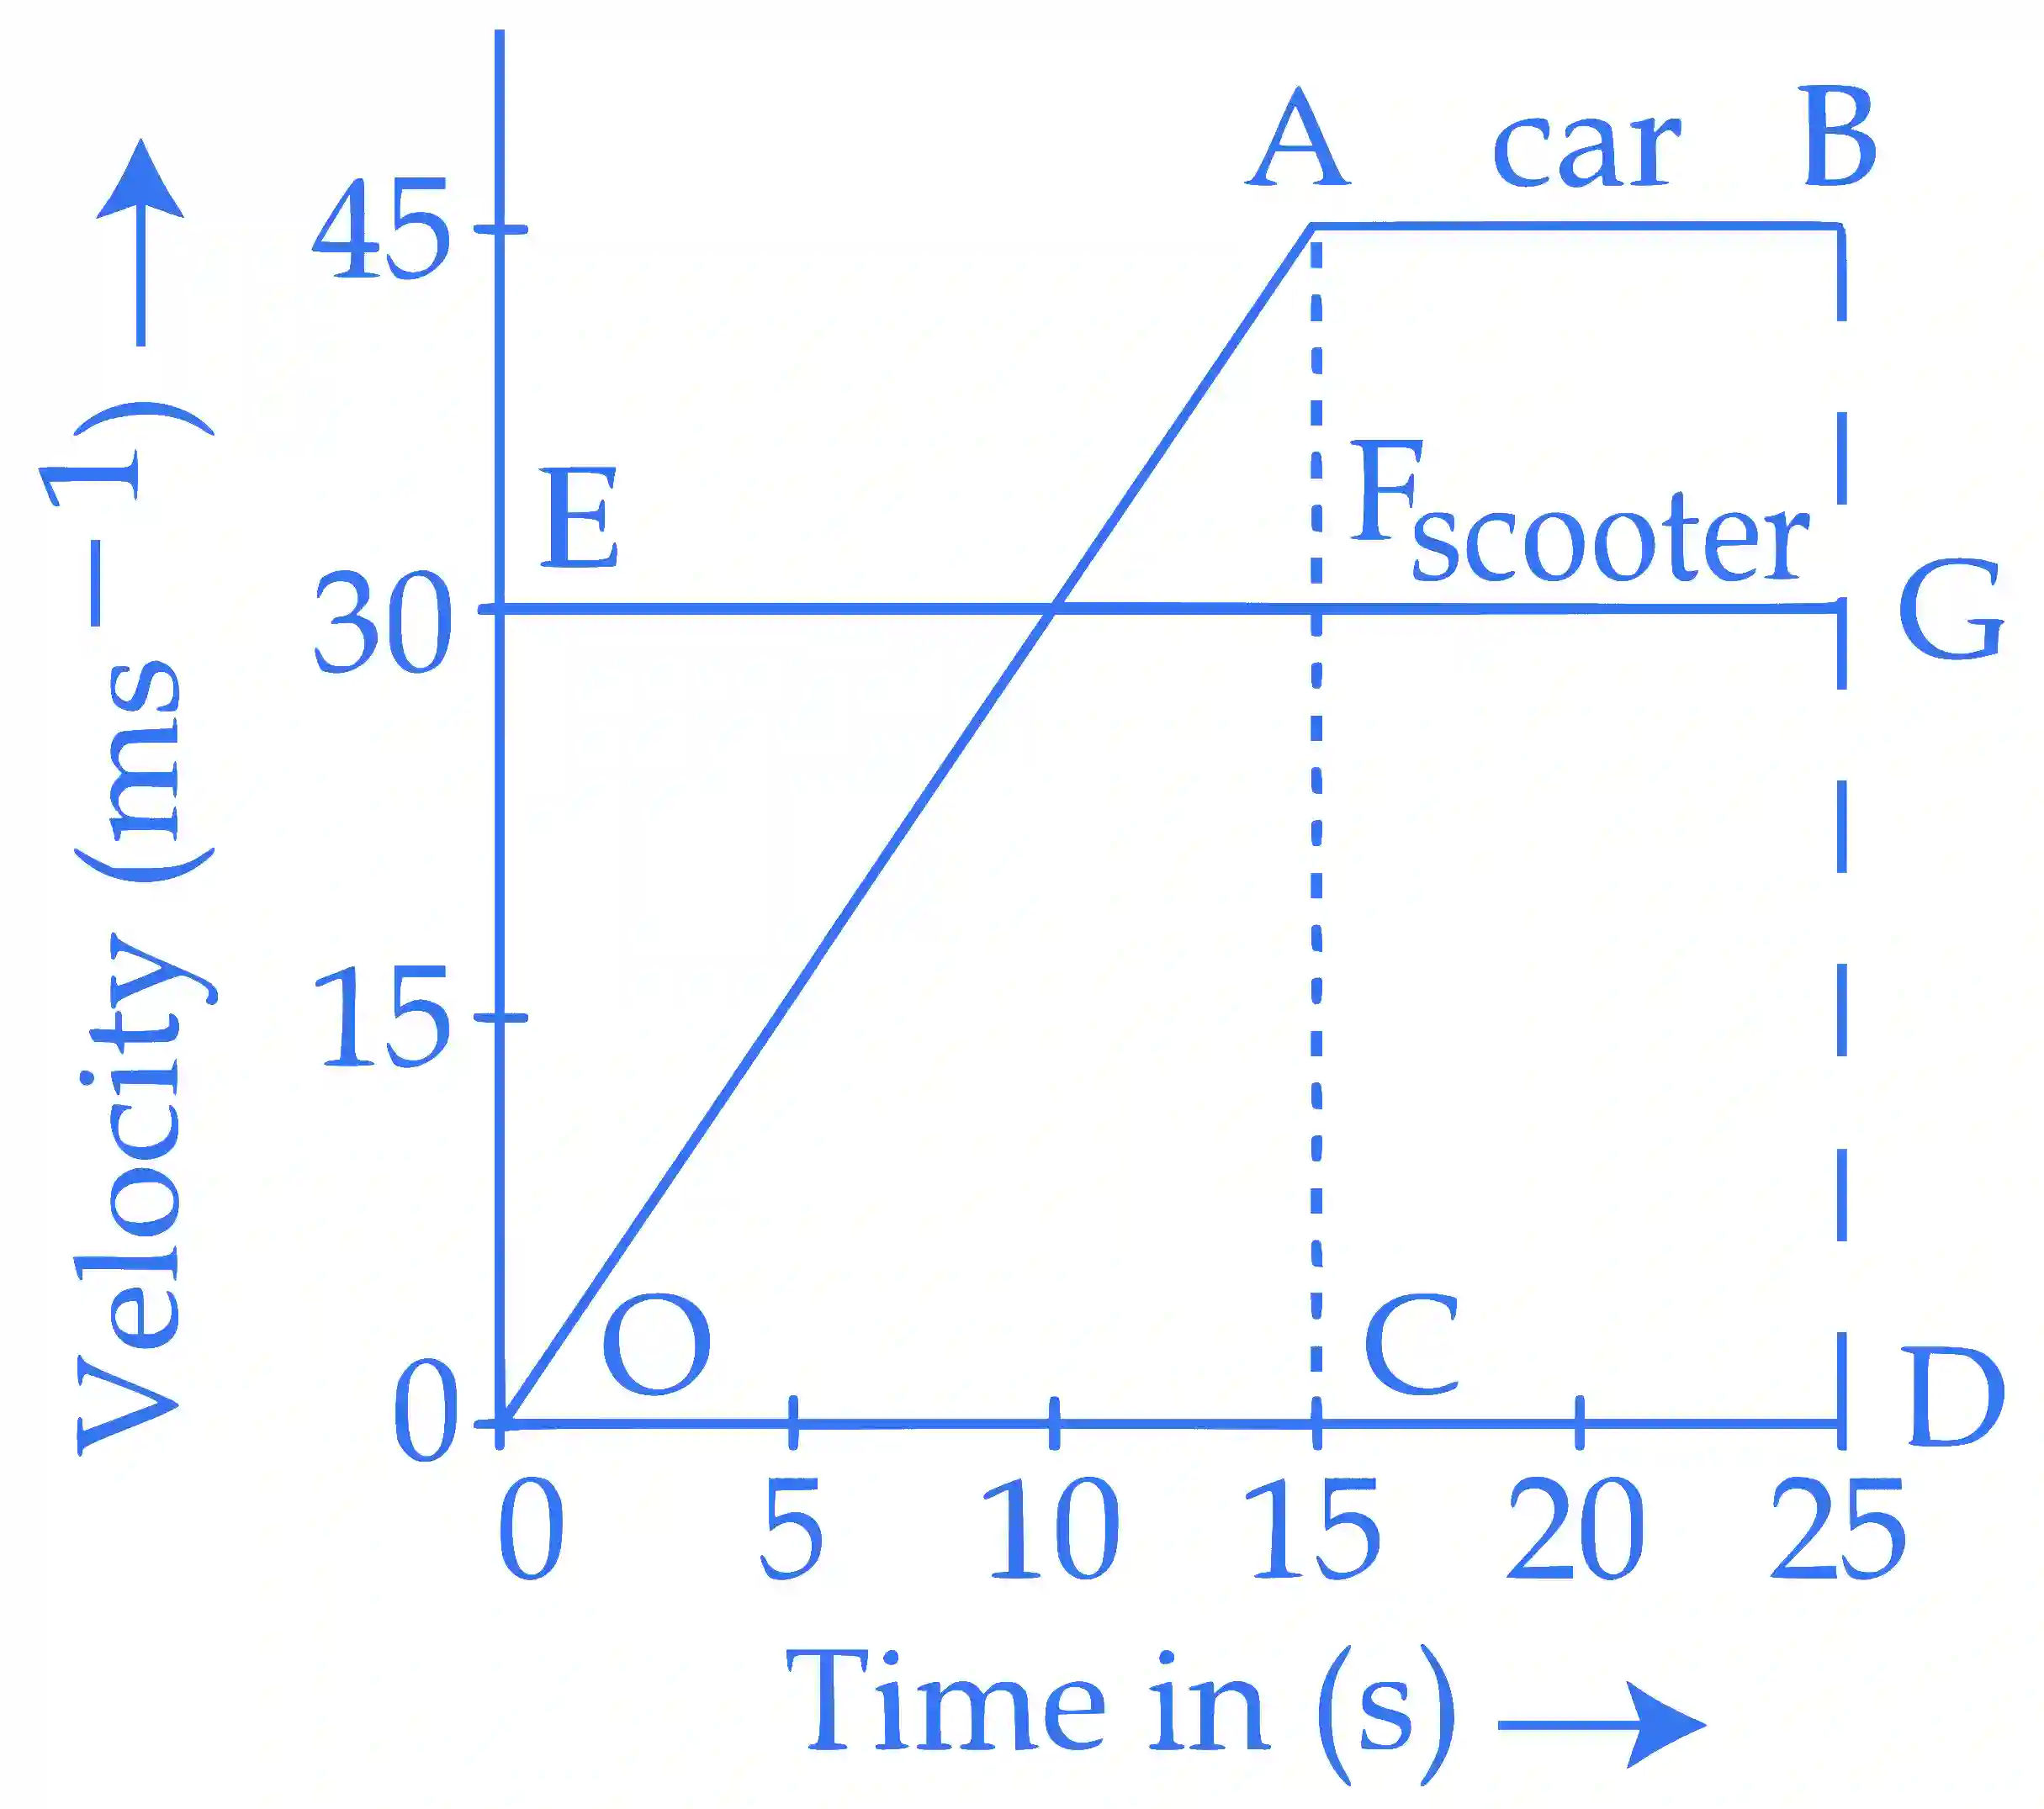
The velocity-time graphs of a car and a scooter are shown in the figure. (i) The difference between the distance travelled by the car and the scooter in and (ii) the time at which the car will catch up with the scooter are, respectively.

Multiple Choice Options
- A and
- B and
- C and
- D and
Step-by-Step Verified Solution
Till 15 sec car has accelerative motion and scooter has constant velocity in entire motion.
Total Distance travelled by the car in 15 sec, = (15)2 = m
Distance travelled by scooter in 15 sec.
= V t = 30 15 = 450 m
Difference between distance travelled by the car and scooter in 15 sec,
= 450 = 112.5 m
Now, assume car catches the scooter in time t,
Car travelled in t sec = scooter travelled in t sec.
+ 45(t 15) = 30 t
337.5 + 45t 675 = 30t
15 t = 337.5
t = 22.5 sec.