Verified Solution • 2025–26 Session
moderate
QJEEM17Ph7c01: JEE Main 2017 Physics - Class 11 JEEM17Ph7c01 Solution: For the P-V diagram given for an ideal gas, out of the…
For the P-V diagram given for an ideal gas,
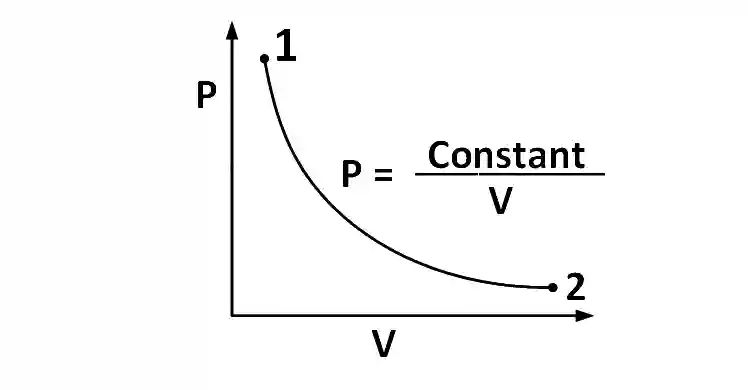
out of the following which one correctly represents the T-P diagram ?
out of the following which one correctly represents the T-P diagram ?
Multiple Choice Options
- A https://ik.imagekit.io/novatra/photos/161f784556ce964d145f7164543972fd2ba0abbf5136e7be951e6cd0536291c4.webp
- B https://ik.imagekit.io/novatra/photos/e301bb9013b6da16bf4c907d058e265c9b6ca161ebcfb1dbf9ecad7601982c59.webp
- C https://ik.imagekit.io/novatra/photos/f87f9ba5ce215d8f77c450f096cb152ec1d87b88881849544f0db14a88d4080c.webp
- D https://ik.imagekit.io/novatra/photos/597be78488d157ce1d121599feb19186fa69e7a4b4bf237cc62535c2197db838.webp
Step-by-Step Verified Solution
We know,
PV = nRT
here R is a constant,
assuming n = number of moles does not change, we get,
PV = KT, K = constant.
Given that, PV = constant,
So, T = constant, Hence the process is isothermol.
From the graph you can see,
Pressure at point 1 is higher than that at point 2. So correct answer is (c)
PV = nRT
here R is a constant,
assuming n = number of moles does not change, we get,
PV = KT, K = constant.
Given that, PV = constant,
So, T = constant, Hence the process is isothermol.
From the graph you can see,
Pressure at point 1 is higher than that at point 2. So correct answer is (c)