Verified Solution • 2025–26 Session
moderate
QJEEM12Phbe28: JEE Main 2012 Physics - Class 12 JEEM12Phbe28 Solution: The figure shows an experimental plot for discharging of a…
The figure shows an experimental plot for discharging of a capacitor in an R-C circuit. The time constant of this circuit lies between 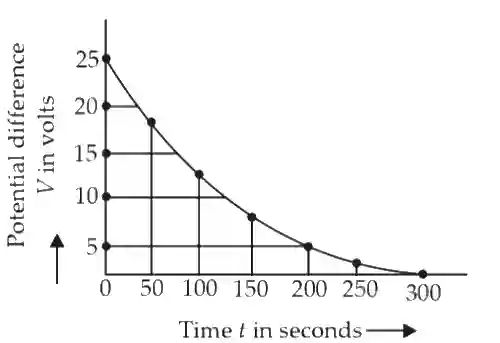
Multiple Choice Options
- A 100 sec and 150 sec
- B 0 and 50 sec
- C 50 sec and 100 sec
- D 150 sec and 200 sec
Step-by-Step Verified Solution
During discharging of a capacitor, V = V0
At t = ,
V = = 0.37V0
From the graph, t = 0, V0 = 25 V
V = 0.37 25 = 9.25 V
This voltage will occur at time between 100 sec and 150 sec. Hence, time constant of this circuit lies between 100 sec and 150 sec.
At t = ,
V = = 0.37V0
From the graph, t = 0, V0 = 25 V
V = 0.37 25 = 9.25 V
This voltage will occur at time between 100 sec and 150 sec. Hence, time constant of this circuit lies between 100 sec and 150 sec.